"Stack Walking" in the .NET Runtime
21 Jan 2019 - 6375 wordsWhat is ‘stack walking’, well as always the ‘Book of the Runtime’ (BotR) helps us, from the relevant page:
The CLR makes heavy use of a technique known as stack walking (or stack crawling). This involves iterating the sequence of call frames for a particular thread, from the most recent (the thread’s current function) back down to the base of the stack.
The runtime uses stack walks for a number of purposes:
- The runtime walks the stacks of all threads during garbage collection, looking for managed roots (local variables holding object references in the frames of managed methods that need to be reported to the GC to keep the objects alive and possibly track their movement if the GC decides to compact the heap).
- On some platforms the stack walker is used during the processing of exceptions (looking for handlers in the first pass and unwinding the stack in the second).
- The debugger uses the functionality when generating managed stack traces.
- Various miscellaneous methods, usually those close to some public managed API, perform a stack walk to pick up information about their caller (such as the method, class or assembly of that caller).
The rest of this post will explore what ‘Stack Walking’ is, how it works and why so many parts of the runtime need to be involved.
Table of Contents
- Where does the CLR use ‘Stack Walking’?
- The ‘Stack Walking’ API
- Unwinding ‘Native’ Code
- Unwinding ‘JITted’ Code
- Further Reading
Where does the CLR use ‘Stack Walking’?
Before we dig into the ‘internals’, let’s take a look at where the runtime utilises ‘stack walking’, below is the full list (as of .NET Core CLR ‘Release 2.2’). All these examples end up calling into the Thread::StackWalkFrames(..) method here and provide a callback that is triggered whenever the API encounters a new section of the stack (see How to use it below for more info).
Common Scenarios
- Garbage Collection (GC)
- Exception Handling (unwinding)
- Exception Handling (resumption):
- Threads:
- Thread Suspension:
Debugging/Diagnostics
- Debugger
- Managed APIs (e.g
System.Diagnostics.StackTrace) - DAC (via by SOS) - Scan for GC ‘Roots’
- Profiling API
- Event Pipe (Diagnostics)
- CLR prints a Stack Trace (to the console/log, DEBUG builds only)
Obscure Scenarios
- Reflection
- Application (App) Domains (See ‘Stack Crawl Marks’ below)
- ‘Code Pitching’
- Extensible Class Factory (
System.Runtime.InteropServices.ExtensibleClassFactory) - Stack Sampler (unused?)
Stack Crawl Marks
One of the above scenarios deserves a closer look, but firstly why are ‘stack crawl marks’ used, from coreclr/issues/#21629 (comment):
Unfortunately, there is a ton of legacy APIs that were added during netstandard2.0 push whose behavior depend on the caller. The caller is basically passed in as an implicit argument to the API. Most of these StackCrawlMarks are there to support these APIs…
So we can see that multiple functions within the CLR itself need to have knowledge of their caller. To understand this some more, let’s look an example, the GetType(string typeName) method. Here’s the flow from the externally-visible method all the way down to where the work is done, note how a StackCrawlMark instance is passed through:
Type::GetType(string typeName)implementation (CreatesStackCrawlMark.LookForMyCaller)RuntimeType::GetType(.., ref StackCrawlMark stackMark)implementationRuntimeType::GetTypeByName(.., ref StackCrawlMark stackMark, ..)implementationextern void GetTypeByName(.., ref StackCrawlMark stackMark, ..)definition (call into native code, i.e.[DllImport(JitHelpers.QCall, ..)])RuntimeTypeHandle::GetTypeByName(.., QCall::StackCrawlMarkHandle pStackMark, ..)implementationTypeHandle TypeName::GetTypeManaged(.., StackCrawlMark* pStackMark, ..)implementationTypeHandle TypeName::GetTypeWorker(.. , StackCrawlMark* pStackMark, ..)implementationSystemDomain::GetCallersAssembly(StackCrawlMark *stackMark,..)implementationSystemDomain::GetCallersModule(StackCrawlMark* stackMark, ..)implementationSystemDomain::CallersMethodCallbackWithStackMark(..)callback implementation
In addition the JIT (via the VM) has to ensure that all relevant methods are available in the call-stack, i.e. they can’t be removed:
- Prevent in-lining
CEEInfo::canInline(..)implementation - Prevent removal via a ‘tail call’
CEEInfo::canTailCall(..)implementation
However, the StackCrawlMark feature is currently being cleaned up, so it may look different in the future:
- Remove NoInlining/StackCrawlMarks from Tasks
- Remove stack marks from GetSatelliteAssembly
- Delete unnecessary StackCrawlMarks in RtFieldInfo
- Avoid passing stack crawl mark unnecessarily deep in the call stack (the example shown above!!)
Exception Handling
The place that most .NET Developers will run into ‘stack traces’ is when dealing with exceptions. I originally intended to also describe ‘exception handling’ here, but then I opened up /src/vm/exceptionhandling.cpp and saw that it contained over 7,000 lines of code!! So I decided that it can wait for a future post 😁.
However, if you want to learn more about the ‘internals’ I really recommend Chris Brumme’s post The Exception Model (2003) which is the definitive guide on the topic (also see his Channel9 Videos) and as always, the ‘BotR’ chapter ‘What Every (Runtime) Dev needs to Know About Exceptions in the Runtime’ is well worth a read.
Also, I recommend talking a look at the slides from the ‘Internals of Exceptions’ talk’ and the related post .NET Inside Out Part 2 — Handling and rethrowing exceptions in C# both by Adam Furmanek.
The ‘Stack Walking’ API
Now that we’ve seen where it’s used, let’s look at the ‘stack walking’ API itself. Firstly, how is it used?
How to use it
It’s worth pointing out that the only way you can access it from C#/F#/VB.NET code is via the StackTrace class, only the runtime itself can call into Thread::StackWalkFrames(..) directly. The simplest usage in the runtime is EventPipe::WalkManagedStackForThread(..) (see here), which is shown below. As you can see it’s as simple as specifying the relevant flags, in this case ALLOW_ASYNC_STACK_WALK | FUNCTIONSONLY | HANDLESKIPPEDFRAMES | ALLOW_INVALID_OBJECTS and then providing the callback, which in the EventPipe class is the StackWalkCallback method (here)
bool EventPipe::WalkManagedStackForThread(Thread *pThread, StackContents &stackContents)
{
    CONTRACTL
    {
        NOTHROW;
        GC_NOTRIGGER;
        MODE_ANY;
        PRECONDITION(pThread != NULL);
    }
    CONTRACTL_END;

    // Calling into StackWalkFrames in preemptive mode violates the host contract,
    // but this contract is not used on CoreCLR.
    CONTRACT_VIOLATION( HostViolation );

    stackContents.Reset();

    StackWalkAction swaRet = pThread->StackWalkFrames(
        (PSTACKWALKFRAMESCALLBACK) &StackWalkCallback,
        &stackContents,
        ALLOW_ASYNC_STACK_WALK | FUNCTIONSONLY | HANDLESKIPPEDFRAMES | ALLOW_INVALID_OBJECTS);

    return ((swaRet == SWA_DONE) || (swaRet == SWA_CONTINUE));
}
The StackWalkFrame(..) function then does the heavy-lifting of actually walking the stack, before triggering the callback shown below. In this case it just records the ‘Instruction Pointer’ (IP/CP) and the ‘managed function’, which is an instance of the MethodDesc obtained via the pCf->GetFunction() call:
StackWalkAction EventPipe::StackWalkCallback(CrawlFrame *pCf, StackContents *pData)
{
    CONTRACTL
    {
        NOTHROW;
        GC_NOTRIGGER;
        MODE_ANY;
        PRECONDITION(pCf != NULL);
        PRECONDITION(pData != NULL);
    }
    CONTRACTL_END;

    // Get the IP.
    UINT_PTR controlPC = (UINT_PTR)pCf->GetRegisterSet()->ControlPC;
    if (controlPC == 0)
    {
        if (pData->GetLength() == 0)
        {
            // This happens for pinvoke stubs on the top of the stack.
            return SWA_CONTINUE;
        }
    }

    _ASSERTE(controlPC != 0);

    // Add the IP to the captured stack.
    pData->Append(controlPC, pCf->GetFunction());

    // Continue the stack walk.
    return SWA_CONTINUE;
}
How it works
Now onto the most interesting part, how to the runtime actually walks the stack. Well, first let’s understand what the stack looks like, from the ‘BotR’ page:
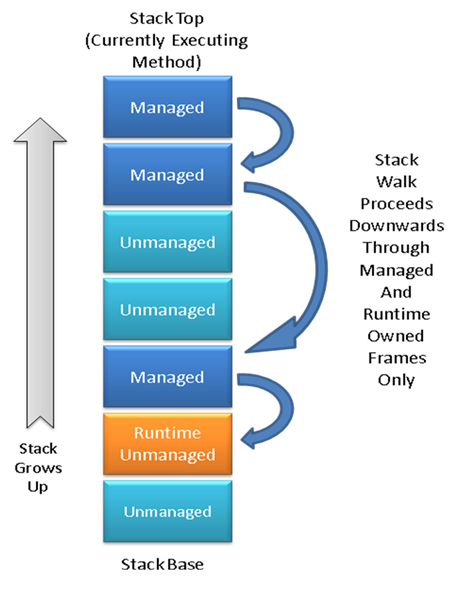
The main thing to note is that a .NET ‘stack’ can contain 3 types of methods:
- Managed - this represents code that started off as C#/F#/VB.NET, was turned into IL and then finally compiled to native code by the ‘JIT Compiler’.
- Unmanaged - completely native code that exists outside of the runtime, i.e. a OS function the runtime calls into or a user call via
P/Invoke. The runtime only cares about transitions into or out of regular unmanaged code, is doesn’t care about the stack frame within it. - Runtime Managed - still native code, but this is slightly different because the runtime case more about this code. For example there are quite a few parts of the Base-Class libraries that make use of
InternalCallmethods, for more on this see the ‘Helper Method’ Frames section later on.
So the ‘stack walk’ has to deal with these different scenarios as it proceeds. Now let’s look at the ‘code flow’ starting with the entry-point method StackWalkFrames(..):
Thread::StackWalkFrames(..)here- the entry-point function, the type of ‘stack walk’ can be controlled via these flags
Thread::StackWalkFramesEx(..)here- worker-function that sets up the
StackFrameIterator, via a call toStackFrameIterator::Init(..)here
- worker-function that sets up the
StackFrameIterator::Next()here, then hands off to the primary worker methodStackFrameIterator::NextRaw()here that does 5 things:CheckForSkippedFrames(..)here, deals with frames that may have been allocated inside a managed stack frame (e.g. an inlined p/invoke call).UnwindStackFrame(..)here, in-turn calls:x64-Thread::VirtualUnwindCallFrame(..)here, then callsVirtualUnwindNonLeafCallFrame(..)here orVirtualUnwindLeafCallFrame(..)here. All of of these functions make use of the Windows API functionRtlLookupFunctionEntry(..)to do the actual unwinding.x86-::UnwindStackFrame(..)here, in turn callsUnwindEpilog(..)here andUnwindEspFrame(..)here. Unlikex64, underx86all the ‘stack-unwinding’ is done manually, within the CLR code.
PostProcessingForManagedFrames(..)here, determines if the stack-walk is actually within a managed method rather than a native frame.ProcessIp(..)here has the job of looking up the current managed method (if any) based on the current instruction pointer (IP). It does this by calling intoEECodeInfo::Init(..)here and then ends up in one of:EEJitManager::JitCodeToMethodInfo(..)here, that uses a very cool looking data structure refereed to as a ‘nibble map’NativeImageJitManager::JitCodeToMethodInfo(..)hereReadyToRunJitManager::JitCodeToMethodInfo(..)here
ProcessCurrentFrame(..)here, does some final house-keeping and tidy-up.
CrawlFrame::GotoNextFrame()here- in-turn calls
pFrame->Next()here to walk through the ‘linked list’ of frames which drive the ‘stack walk’ (more on these ‘frames’ later)
- in-turn calls
StackFrameIterator::Filter()here- essentially a huge
switchstatement that handles all the different Frame States and decides whether or not the ‘stack walk’ should continue.
- essentially a huge
When it gets a valid frame it triggers the callback in Thread::MakeStackwalkerCallback(..) here and passes in a pointer to the current CrawlFrame class defined here, this exposes methods such as IsFrameless(), GetFunction() and GetThisPointer(). The CrawlFrame actually represents 2 scenarios, based on the current IP:
- Native code, represented by a
Frameclass defined here, which we’ll discuss more in a moment. - Managed code, well technically ‘managed code’ that was JITted to ‘native code’, so more accurately a managed stack frame. In this situation the
MethodDescclass defined here is provided, you can read more about this key CLR data-structure in the corresponding BotR chapter.
See it ‘in Action’
Fortunately we’re able to turn on some nice diagnostics in a debug build of the CLR (COMPLUS_LogEnable, COMPLUS_LogToFile & COMPLUS_LogFacility). With that in place, given C# code like this:
internal class Program {
    private static void Main() {
        MethodA();
    }

    [MethodImpl(MethodImplOptions.NoInlining)]
    private void MethodA() {
        MethodB();
    }

    [MethodImpl(MethodImplOptions.NoInlining)]
    private void MethodB() {
        MethodC();
    }

    [MethodImpl(MethodImplOptions.NoInlining)]
    private void MethodC() {
        var stackTrace = new StackTrace(fNeedFileInfo: true);
        Console.WriteLine(stackTrace.ToString());
    }
}
We get the output shown below, in which you can see the ‘stack walking’ process. It starts in InitializeSourceInfo and CaptureStackTrace which are methods internal to the StackTrace class (see here), before moving up the stack MethodC -> MethodB -> MethodA and then finally stopping in the Main function. Along the way its does a ‘FILTER’ and ‘CONSIDER’ step before actually unwinding (‘finished unwind for …’):
TID 4740: STACKWALK    starting with partial context
TID 4740: STACKWALK: [000] FILTER  : EXPLICIT : PC= 00000000`00000000  SP= 00000000`00000000  Frame= 00000002`9977cc48  vtbl= 00007ffd`74a105b0
TID 4740: STACKWALK: [001] CONSIDER: EXPLICIT : PC= 00000000`00000000  SP= 00000000`00000000  Frame= 00000002`9977cc48  vtbl= 00007ffd`74a105b0
TID 4740: STACKWALK: [001] FILTER  : EXPLICIT : PC= 00000000`00000000  SP= 00000000`00000000  Frame= 00000002`9977cc48  vtbl= 00007ffd`74a105b0
TID 4740: STACKWALK: [002] CONSIDER: EXPLICIT : PC= 00000000`00000000  SP= 00000000`00000000  Frame= 00000002`9977cdd8  vtbl= 00007ffd`74995220
TID 4740: STACKWALK    LazyMachState::unwindLazyState(ip:00007FFD7439C45C,sp:000000029977C338)
TID 4740: STACKWALK: [002] CALLBACK: EXPLICIT : PC= 00000000`00000000  SP= 00000000`00000000  Frame= 00000002`9977cdd8  vtbl= 00007ffd`74995220
TID 4740: STACKWALK    HelperMethodFrame::UpdateRegDisplay cached ip:00007FFD72FE9258, sp:000000029977D300
TID 4740: STACKWALK: [003] CONSIDER: FRAMELESS: PC= 00007ffd`72fe9258  SP= 00000002`9977d300  method=InitializeSourceInfo
TID 4740: STACKWALK: [003] CALLBACK: FRAMELESS: PC= 00007ffd`72fe9258  SP= 00000002`9977d300  method=InitializeSourceInfo
TID 4740: STACKWALK: [004] about to unwind for 'InitializeSourceInfo', SP: 00000002`9977d300 , IP: 00007ffd`72fe9258
TID 4740: STACKWALK: [004] finished unwind for 'InitializeSourceInfo', SP: 00000002`9977d480 , IP: 00007ffd`72eeb671
TID 4740: STACKWALK: [004] CONSIDER: FRAMELESS: PC= 00007ffd`72eeb671  SP= 00000002`9977d480  method=CaptureStackTrace
TID 4740: STACKWALK: [004] CALLBACK: FRAMELESS: PC= 00007ffd`72eeb671  SP= 00000002`9977d480  method=CaptureStackTrace
TID 4740: STACKWALK: [005] about to unwind for 'CaptureStackTrace', SP: 00000002`9977d480 , IP: 00007ffd`72eeb671
TID 4740: STACKWALK: [005] finished unwind for 'CaptureStackTrace', SP: 00000002`9977d5b0 , IP: 00007ffd`72eeadd0
TID 4740: STACKWALK: [005] CONSIDER: FRAMELESS: PC= 00007ffd`72eeadd0  SP= 00000002`9977d5b0  method=.ctor
TID 4740: STACKWALK: [005] CALLBACK: FRAMELESS: PC= 00007ffd`72eeadd0  SP= 00000002`9977d5b0  method=.ctor
TID 4740: STACKWALK: [006] about to unwind for '.ctor', SP: 00000002`9977d5b0 , IP: 00007ffd`72eeadd0
TID 4740: STACKWALK: [006] finished unwind for '.ctor', SP: 00000002`9977d5f0 , IP: 00007ffd`14c620d3
TID 4740: STACKWALK: [006] CONSIDER: FRAMELESS: PC= 00007ffd`14c620d3  SP= 00000002`9977d5f0  method=MethodC
TID 4740: STACKWALK: [006] CALLBACK: FRAMELESS: PC= 00007ffd`14c620d3  SP= 00000002`9977d5f0  method=MethodC
TID 4740: STACKWALK: [007] about to unwind for 'MethodC', SP: 00000002`9977d5f0 , IP: 00007ffd`14c620d3
TID 4740: STACKWALK: [007] finished unwind for 'MethodC', SP: 00000002`9977d630 , IP: 00007ffd`14c62066
TID 4740: STACKWALK: [007] CONSIDER: FRAMELESS: PC= 00007ffd`14c62066  SP= 00000002`9977d630  method=MethodB
TID 4740: STACKWALK: [007] CALLBACK: FRAMELESS: PC= 00007ffd`14c62066  SP= 00000002`9977d630  method=MethodB
TID 4740: STACKWALK: [008] about to unwind for 'MethodB', SP: 00000002`9977d630 , IP: 00007ffd`14c62066
TID 4740: STACKWALK: [008] finished unwind for 'MethodB', SP: 00000002`9977d660 , IP: 00007ffd`14c62016
TID 4740: STACKWALK: [008] CONSIDER: FRAMELESS: PC= 00007ffd`14c62016  SP= 00000002`9977d660  method=MethodA
TID 4740: STACKWALK: [008] CALLBACK: FRAMELESS: PC= 00007ffd`14c62016  SP= 00000002`9977d660  method=MethodA
TID 4740: STACKWALK: [009] about to unwind for 'MethodA', SP: 00000002`9977d660 , IP: 00007ffd`14c62016
TID 4740: STACKWALK: [009] finished unwind for 'MethodA', SP: 00000002`9977d690 , IP: 00007ffd`14c61f65
TID 4740: STACKWALK: [009] CONSIDER: FRAMELESS: PC= 00007ffd`14c61f65  SP= 00000002`9977d690  method=Main
TID 4740: STACKWALK: [009] CALLBACK: FRAMELESS: PC= 00007ffd`14c61f65  SP= 00000002`9977d690  method=Main
TID 4740: STACKWALK: [00a] about to unwind for 'Main', SP: 00000002`9977d690 , IP: 00007ffd`14c61f65
TID 4740: STACKWALK: [00a] finished unwind for 'Main', SP: 00000002`9977d6d0 , IP: 00007ffd`742f9073
TID 4740: STACKWALK: [00a] FILTER  : NATIVE   : PC= 00007ffd`742f9073  SP= 00000002`9977d6d0
TID 4740: STACKWALK: [00b] CONSIDER: EXPLICIT : PC= 00007ffd`742f9073  SP= 00000002`9977d6d0  Frame= 00000002`9977de58  vtbl= 00007ffd`74a105b0
TID 4740: STACKWALK: [00b] FILTER  : EXPLICIT : PC= 00007ffd`742f9073  SP= 00000002`9977d6d0  Frame= 00000002`9977de58  vtbl= 00007ffd`74a105b0
TID 4740: STACKWALK: [00c] CONSIDER: EXPLICIT : PC= 00007ffd`742f9073  SP= 00000002`9977d6d0  Frame= 00000002`9977e7e0  vtbl= 00007ffd`74a105b0
TID 4740: STACKWALK: [00c] FILTER  : EXPLICIT : PC= 00007ffd`742f9073  SP= 00000002`9977d6d0  Frame= 00000002`9977e7e0  vtbl= 00007ffd`74a105b0
TID 4740: STACKWALK: SWA_DONE: reached the end of the stack
To find out more, you can search for these diagnostic message in \vm\stackwalk.cpp, e.g. in Thread::DebugLogStackWalkInfo(..) here
Unwinding ‘Native’ Code
As explained in this excellent article:
There are fundamentally two main ways to implement exception propagation in an ABI (Application Binary Interface):
“dynamic registration”, with frame pointers in each activation record, organized as a linked list. This makes stack unwinding fast at the expense of having to set up the frame pointer in each function that calls other functions. This is also simpler to implement.
“table-driven”, where the compiler and assembler create data structures alongside the program code to indicate which addresses of code correspond to which sizes of activation records. This is called “Call Frame Information” (CFI) data in e.g. the GNU tool chain. When an exception is generated, the data in this table is loaded to determine how to unwind. This makes exception propagation slower but the general case faster.
It turns out that .NET uses the ‘table-driven’ approach, for the reason explained in the ‘BotR’:
The exact definition of a frame varies from platform to platform and on many platforms there isn’t a hard definition of a frame format that all functions adhere to (x86 is an example of this). Instead the compiler is often free to optimize the exact format of frames. On such systems it is not possible to guarantee that a stackwalk will return 100% correct or complete results (for debugging purposes, debug symbols such as pdbs are used to fill in the gaps so that debuggers can generate more accurate stack traces).
This is not a problem for the CLR, however, since we do not require a fully generalized stack walk. Instead we are only interested in those frames that are managed (i.e. represent a managed method) or, to some extent, frames coming from unmanaged code used to implement part of the runtime itself. In particular there is no guarantee about fidelity of 3rd party unmanaged frames other than to note where such frames transition into or out of the runtime itself (i.e. one of the frame types we do care about).
Frames
To enable ‘unwinding’ of native code or more strictly the transitions ‘into’ and ‘out of’ native code, the CLR uses a mechanism of Frames, which are defined in the source code here. These frames are arranged into a hierachy and there is one type of Frame for each scenario, for more info on these individual Frames take a look at the excellent source-code comments here.
- Frame (abstract/base class)
- GCFrame
- FaultingExceptionFrame
- HijackFrame
- ResumableFrame
- RedirectedThreadFrame
- InlinedCallFrame
- HelperMethodFrame
- HelperMethodFrame_1OBJ
- HelperMethodFrame_2OBJ
- HelperMethodFrame_3OBJ
- HelperMethodFrame_PROTECTOBJ
- TransitionFrame
- StubHelperFrame
- SecureDelegateFrame
- MulticastFrame
- FramedMethodFrame
- ComPlusMethodFrame
- PInvokeCalliFrame
- PrestubMethodFrame
- StubDispatchFrame
- ExternalMethodFrame
- TPMethodFrame
- UnmanagedToManagedFrame
- ComMethodFrame
- ComPrestubMethodFrame
- UMThkCallFrame
- ComMethodFrame
- ContextTransitionFrame
- TailCallFrame
- ProtectByRefsFrame
- ProtectValueClassFrame
- DebuggerClassInitMarkFrame
- DebuggerSecurityCodeMarkFrame
- DebuggerExitFrame
- DebuggerU2MCatchHandlerFrame
- FuncEvalFrame
- ExceptionFilterFrame
‘Helper Method’ Frames
But to make sense of this, let’s look at one type of Frame, known as HelperMethodFrame (above). This is used when .NET code in the runtime calls into C++ code to do the heavy-lifting, often for performance reasons. One example is if you call Environment.GetCommandLineArgs() you end up in this code (C#), but note that it ends up calling an extern method marked with InternalCall:
[MethodImplAttribute(MethodImplOptions.InternalCall)]
private static extern string[] GetCommandLineArgsNative();
This means that the rest of the method is implemented in the runtime in C++, you can see how the method call is wired up, before ending up SystemNative::GetCommandLineArgs here, which is shown below:
FCIMPL0(Object*, SystemNative::GetCommandLineArgs)
{
    FCALL_CONTRACT;

    PTRARRAYREF strArray = NULL;

    HELPER_METHOD_FRAME_BEGIN_RET_1(strArray); // <-- 'Helper method Frame' started here

    // Error handling and setup code removed for clarity

    strArray = (PTRARRAYREF) AllocateObjectArray(numArgs, g_pStringClass);
    // Copy each argument into new Strings.
    for(unsigned int i=0; i<numArgs; i++)
    {
        STRINGREF str = StringObject::NewString(argv[i]);
        STRINGREF * destData = ((STRINGREF*)(strArray->GetDataPtr())) + i;
        SetObjectReference((OBJECTREF*)destData, (OBJECTREF)str, strArray->GetAppDomain());
    }
    delete [] argv;

    HELPER_METHOD_FRAME_END(); // <-- 'Helper method Frame' ended/closed here

    return OBJECTREFToObject(strArray);
}
FCIMPLEND
Note: this code makes heavy use of macros, see this gist for the original code and then the expanded versions (Release and Debug). In addition, if you want more information on these mysterious FCalls as they are known (and the related QCalls) see Mscorlib and Calling Into the Runtime in the ‘BotR’.
But the main thing to look at in the code sample is the HELPER_METHOD_FRAME_BEGIN_RET_1() macro, with ultimately installs an instance of the HelperMethodFrame_1OBJ class. The macro expands into code like this:
FrameWithCookie < HelperMethodFrame_1OBJ > __helperframe(__me, Frame::FRAME_ATTR_NONE, (OBJECTREF * ) & strArray);
{
  __helperframe.Push(); // <-- 'Helper method Frame' pushed

  Thread * CURRENT_THREAD = __helperframe.GetThread();
  const bool CURRENT_THREAD_AVAILABLE = true;
  (void) CURRENT_THREAD_AVAILABLE;; {
	Exception * __pUnCException = 0;
	Frame * __pUnCEntryFrame = ( & __helperframe);
	bool __fExceptionCatched = false;;
	try {;

	  // Original code from SystemNative::GetCommandLineArgs goes in here

	} catch (Exception * __pException) {;
	  do {} while (0);
	  __pUnCException = __pException;
	  UnwindAndContinueRethrowHelperInsideCatch(__pUnCEntryFrame, __pUnCException);
	  __fExceptionCatched = true;;
	}
	if (__fExceptionCatched) {;
	  UnwindAndContinueRethrowHelperAfterCatch(__pUnCEntryFrame, __pUnCException);
	}
  };

  __helperframe.Pop(); // <-- 'Helper method Frame' popped
};
Note: the Push() and Pop() against _helperMethodFrame that make it available for ‘stack walking’. You can also see the try/catch block that the CLR puts in place to ensure any exceptions from native code are turned into managed exceptions that C#/F#/VB.NET code can handle. If you’re interested the full macro-expansion is available in this gist.
So in summary, these Frames are pushed onto a ‘linked list’ when calling into native code and popped off the list when returning from native code. This means that are any moment the ‘linked list’ contains all the current or active Frames.
Native Unwind Information
In addition to creating ‘Frames’, the CLR also ensures that the C++ compiler emits ‘unwind info’ for native code. We can see this if we use the DUMPBIN tool and run dumpbin /UNWINDINFO coreclr.dll. We get the following output for SystemNative::GetCommandLineArgs(..) (that we looked at before):
  0002F064 003789B0 00378B7E 004ED1D8  ?GetCommandLineArgs@SystemNative@@SAPEAVObject@@XZ (public: static class Object * __cdecl SystemNative::GetCommandLineArgs(void))
    Unwind version: 1
    Unwind flags: EHANDLER UHANDLER
    Size of prologue: 0x3B
    Count of codes: 13
    Unwind codes:
      29: SAVE_NONVOL, register=r12 offset=0x1C8
      25: SAVE_NONVOL, register=rdi offset=0x1C0
      21: SAVE_NONVOL, register=rsi offset=0x1B8
      1D: SAVE_NONVOL, register=rbx offset=0x1B0
      10: ALLOC_LARGE, size=0x190
      09: PUSH_NONVOL, register=r15
      07: PUSH_NONVOL, register=r14
      05: PUSH_NONVOL, register=r13
    Handler: 00148F14 __GSHandlerCheck_EH
    EH Handler Data: 00415990
    GS Unwind flags: EHandler UHandler
    Cookie Offset: 00000180

  0002F070 00378B7E 00378BB4 004ED26C
    Unwind version: 1
    Unwind flags: EHANDLER UHANDLER
    Size of prologue: 0x0A
    Count of codes: 2
    Unwind codes:
      0A: ALLOC_SMALL, size=0x20
      06: PUSH_NONVOL, register=rbp
    Handler: 0014978C __CxxFrameHandler3
    EH Handler Data: 00415990
If you want to understand more of what’s going on here I really recommend reading the excellent article x64 Manual Stack Reconstruction and Stack Walking. But in essence the ‘unwind info’ describes which registers are used within a method and how big stack is for that method. These pieces of information are enough to tell the runtime how to ‘unwind’ that particular method when walking the stack.
Differences between Windows and Unix
However, to further complicate things, the ‘native code unwinding’ uses a different mechanism for ‘Windows’ v. ‘Unix’, as explained in coreclr/issues/#177 (comment):
- Stack walker for managed code. JIT will generate regular Windows style unwinding info. We will reuse Windows unwinder code that we currently have checked in for debugger components for unwinding calls in managed code on Linux/Mac. Unfortunately, this work requires changes in the runtime that currently cannot be tested in the CoreCLR repo so it is hard to do this in the public right now. But we are working on fixing that because, as I mentioned at the beginning, our goal is do most work in the public.
- Stack walker for native code. Here, in addition to everything else, we need to allow GC to unwind native stack of any thread in the current process until it finds a managed frame. Currently we are considering using libunwind (http://www.nongnu.org/libunwind) for unwinding native call stacks. @janvorli did some prototyping/experiments and it seems to do what we need. If you have any experience with this library or have any comments/suggestions please let us know.
This also shows that there are 2 different ‘unwind’ mechanisms for ‘managed’ or ‘native’ code, we will discuss how the “stack walker for managed code” works in Unwinding ‘JITted’ Code.
There is also some more information in coreclr/issues/#177 (comment):
My current work has two parts, as @sergiy-k has already mentioned. The windows style unwinder that will be used for the jitted code and Unix unwinder for native code that uses the libunwind’s low level
unw_xxxxfunctions likeunw_stepetc.
So, for ‘native code’ the runtime uses an OS specific mechanism, i.e. on Unix the Open Source ‘libunwind’ library is used. You can see the differences in the code below (from here), under Windows Thread::VirtualUnwindCallFrame(..) (implementation) is called, but on Unix (i.e. FEATURE_PAL) PAL_VirtualUnwind(..) (implementation) is called instead:
#ifndef FEATURE_PAL
    pvControlPc = Thread::VirtualUnwindCallFrame(&ctx, &nonVolRegPtrs);
#else // !FEATURE_PAL
    ...
    BOOL success = PAL_VirtualUnwind(&ctx, &nonVolRegPtrs);
    ...
    pvControlPc = GetIP(&ctx);
#endif // !FEATURE_PAL
Before we more on, here are some links to the work that was done to support ‘stack walking’ when .NET Core CLR was ported to Linux:
- [x86/Linux] Support Simple Exception Catch
- [ARM/Linux] coreclr fails due to lack of DWARF feature in libunwind #6698
- Modify the windows amd64 unwinder to work as jitted code unwinder on Uni… #259
- Refactor libunwind to work on osx #284
- Reimplement native exception handling for PAL #308
- Move the windows unwinder code out of the debug folder.
- .NET Core Dependencies (includes ‘libunwind’)
- The sos “ClrStack” command now works
Unwinding ‘JITted’ Code
Finally, we’re going to look at what happens with ‘managed code’, i.e. code that started off as C#/F#/VB.NET, was turned into IL and then compiled into native code by the ‘JIT Compiler’. This is the code that you generally want to see in your ‘stack trace’, because it’s code you wrote yourself!
Help from the ‘JIT Compiler’
Simply, what happens is that when the code is ‘JITted’, the compiler also emits some extra information, stored via the EECodeInfo class, which is defined here. Also see the ‘Unwind Info’ section in the JIT Compiler <-> Runtime interface, note how it features seperate sections for TARGET_ARM, TARGET_ARM64, TARGET_X86 and TARGET_UNIX.
In addition, in CodeGen::genFnProlog() here the JIT emits a function ‘prologue’ that contains several pieces of ‘unwind’ related data. This is also imlemented in CEEJitInfo::allocUnwindInfo(..) in this piece of code, which behaves differently for each CPU architecture:
#if defined(_TARGET_X86_)
    // Do NOTHING
#elif defined(_TARGET_AMD64_)
    pUnwindInfo->Flags = UNW_FLAG_EHANDLER | UNW_FLAG_UHANDLER;
    ULONG * pPersonalityRoutine = (ULONG*)ALIGN_UP(&(pUnwindInfo->UnwindCode[pUnwindInfo->CountOfUnwindCodes]), sizeof(ULONG));
    *pPersonalityRoutine = ExecutionManager::GetCLRPersonalityRoutineValue();
#elif defined(_TARGET_ARM64_)
    *(LONG *)pUnwindInfo |= (1 << 20); // X bit
    ULONG * pPersonalityRoutine = (ULONG*)((BYTE *)pUnwindInfo + ALIGN_UP(unwindSize, sizeof(ULONG)));
    *pPersonalityRoutine = ExecutionManager::GetCLRPersonalityRoutineValue();
#elif defined(_TARGET_ARM_)
    *(LONG *)pUnwindInfo |= (1 << 20); // X bit
    ULONG * pPersonalityRoutine = (ULONG*)((BYTE *)pUnwindInfo + ALIGN_UP(unwindSize, sizeof(ULONG)));
    *pPersonalityRoutine = (TADDR)ProcessCLRException - baseAddress;
#endif
Also, the JIT has several Compiler::unwindXXX(..) methods, that are all implemented in per-CPU source files:
- /src/jit/unwind.cpp
- /src/jit/unwindarm.cpp
- /src/jit/unwindx86.cpp
- /src/jit/unwindamd64.cpp
- src/jit/unwindarm64.cpp
Fortunately, we can ask the JIT to output the unwind info that it emits, however this only works with a Debug version of the CLR. Given a simple method like this:
private void MethodA() {
    try {
        MethodB();
    } catch (Exception ex) {
        Console.WriteLine(ex.ToString());
    }
}
if we call SET COMPlus_JitUnwindDump=MethodA, we get the following output with 2 ‘Unwind Info’ sections, one for the try and the other for the catch block:
Unwind Info:
  >> Start offset   : 0x000000 (not in unwind data)
  >>   End offset   : 0x00004e (not in unwind data)
  Version           : 1
  Flags             : 0x00
  SizeOfProlog      : 0x07
  CountOfUnwindCodes: 4
  FrameRegister     : none (0)
  FrameOffset       : N/A (no FrameRegister) (Value=0)
  UnwindCodes       :
    CodeOffset: 0x07 UnwindOp: UWOP_ALLOC_SMALL (2)     OpInfo: 11 * 8 + 8 = 96 = 0x60
    CodeOffset: 0x03 UnwindOp: UWOP_PUSH_NONVOL (0)     OpInfo: rsi (6)
    CodeOffset: 0x02 UnwindOp: UWOP_PUSH_NONVOL (0)     OpInfo: rdi (7)
    CodeOffset: 0x01 UnwindOp: UWOP_PUSH_NONVOL (0)     OpInfo: rbp (5)
Unwind Info:
  >> Start offset   : 0x00004e (not in unwind data)
  >>   End offset   : 0x0000e2 (not in unwind data)
  Version           : 1
  Flags             : 0x00
  SizeOfProlog      : 0x07
  CountOfUnwindCodes: 4
  FrameRegister     : none (0)
  FrameOffset       : N/A (no FrameRegister) (Value=0)
  UnwindCodes       :
    CodeOffset: 0x07 UnwindOp: UWOP_ALLOC_SMALL (2)     OpInfo: 5 * 8 + 8 = 48 = 0x30
    CodeOffset: 0x03 UnwindOp: UWOP_PUSH_NONVOL (0)     OpInfo: rsi (6)
    CodeOffset: 0x02 UnwindOp: UWOP_PUSH_NONVOL (0)     OpInfo: rdi (7)
    CodeOffset: 0x01 UnwindOp: UWOP_PUSH_NONVOL (0)     OpInfo: rbp (5)
This ‘unwind info’ is then looked up during a ‘stack walk’ as explained in the How it works section above.
So next time you encounter a ‘stack trace’ remember that a lot of work went into making it possible!!
Further Reading
‘Stack Walking’ or ‘Stack Unwinding’ is a very large topic, so if you want to know more, here are some links to get you started:
Stack Unwinding (general)
- Stack frame layout on x86-64 (also has a great list of links at the bottom)
- Where the top of the stack is on x86
- Programmatic access to the call stack in C++
- How debuggers work: Part 3 - Debugging information
- Writing a Linux Debugger Part 8: Stack unwinding
- Deep Wizardry: Stack Unwinding
- Deep Wizardry: Stack Unwinding (/r/programmming)
- On libunwind and dynamically generated code on x86-64
- On libunwind and dynamically generated code on x86-64 (HackerNews)
- x86 Disassembly/Functions and Stack Frames
- What is the purpose of the EBP frame pointer register?
- Manual Stack Walking
- Walking the Stack Without Symbols and With FPO (Frame Pointer Omission)
- how to write a debuggable programming language - stack unwinding
- How the .NET Runtime Walks the Stack (/r/programming discussion of the ‘BorR’ page)
- Caller Info Attributes vs. Stack Walking
- Stacking the Deck – Finding Your Way Through the Stack
Stack Unwinding (other runtimes)
In addition, it’s interesting to look at how other runtimes handles this process:
- Mono
- CoreRT (A .NET Runtime for AOT)
- High-level Engineering Plan - Runtime
- /src/Native/Runtime/unix/UnwindHelpers.cpp
- /src/Native/Runtime/StackFrameIterator.cpp (see
StackFrameIterator::NextInternal()) - /src/Native/libunwind
- Go
- The Go low-level calling convention on x86-64
- Go Internals - Chapter I: A Primer on Go Assembly
- Go Profiler Internals
- golang.org/src/runtime/stack.go
- golang.org/src/runtime/traceback.go (see
gentraceback(..)) - golang.org/src/runtime/symtab.go (see
findfunc(..)) - Language Mechanics On Stacks And Pointers
- Generating Stack Traces in Go
- Java
- JEP 259: Stack-Walking API
- A Visual Look at JVM Stacks and Frames
- The Java Virtual Machine - The Java Stack
- The Structure of the Java Virtual Machine - Native Method Stacks
- Stack Walking - Dynamic Runtime Layer Virtual Machine Developer’s Guide
- A Study of Exception Handling and Its Dynamic Optimization in Java (pdf)
- Chapter 8 of ‘Advanced Design and Implementation of Virtual Machines’
- Rust