Analysing .NET start-up time with Flamegraphs
03 Mar 2020 - 1074 wordsRecently I gave a talk at the NYAN Conference called ‘From ‘dotnet run’ to ‘hello world’:
In the talk I demonstrate how you can use PerfView to analyse where the .NET Runtime is spending it’s time during start-up:
This post is a step-by-step guide to that demo.
Code Sample
For this exercise I delibrately only look at what the .NET Runtime is doing during program start-up, so I ensure the minimum amount of user code is runing, hence the following ‘Hello World’:
using System;

namespace HelloWorld
{
    class Program
    {
        static void Main(string[] args)
        {
            Console.WriteLine("Hello World!");
            Console.WriteLine("Press <ENTER> to exit");
            Console.ReadLine();
        }
    }
}
The Console.ReadLine() call is added because I want to ensure the process doesn’t exit whilst PerfView is still collecting data.
Data Collection
PerfView is a very powerful program, but not the most user-friendly of tools, so I’ve put togerther a step-by-step guide:
- Download and run a recent version of ‘PerfView.exe’
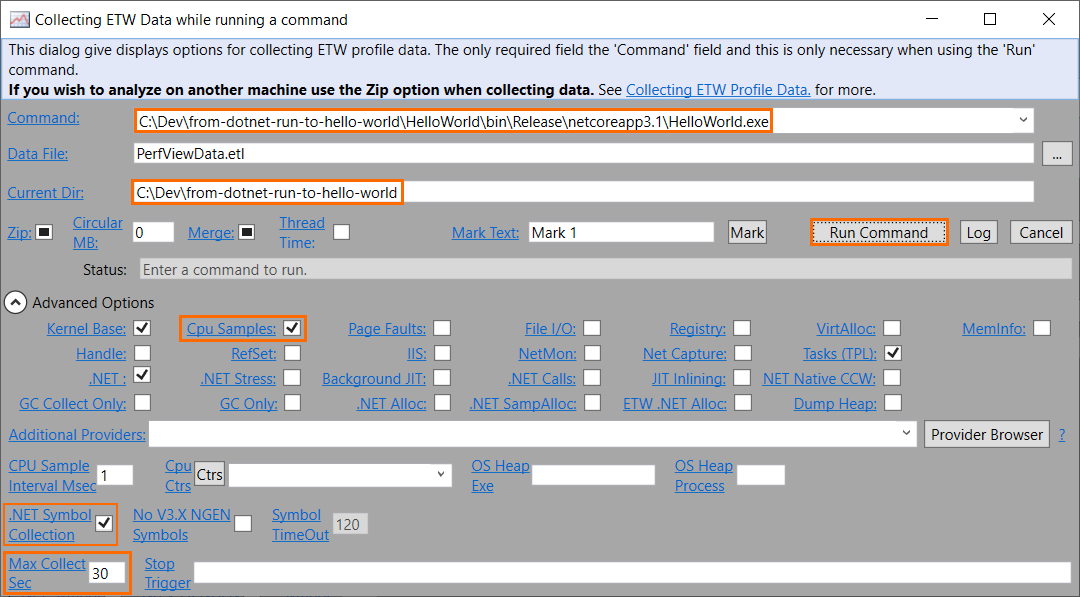
- Click ‘Run a command’ or (Alt-R’) and “collect data while the command is running”
- Ensure that you’ve entered values for:
- “Command”
- “Current Dir”
- Tick ‘Cpu Samples’ if it isn’t already selected
- Set ‘Max Collect Sec’ to 15 seconds (because our ‘HelloWorld’ app never exits, we need to ensure PerfView stops collecting data at some point)
- Ensure that ‘.NET Symbol Collection’ is selected
- Hit ‘Run Command
If you then inspect the log you can see that it’s collecting data, obtaining symbols and then finally writing everything out to a .zip file. Once the process is complete you should see the newly created file in the left-hand pane of the main UI, in this case it’s called ‘PerfViewData.etl.zip’
Data Processing
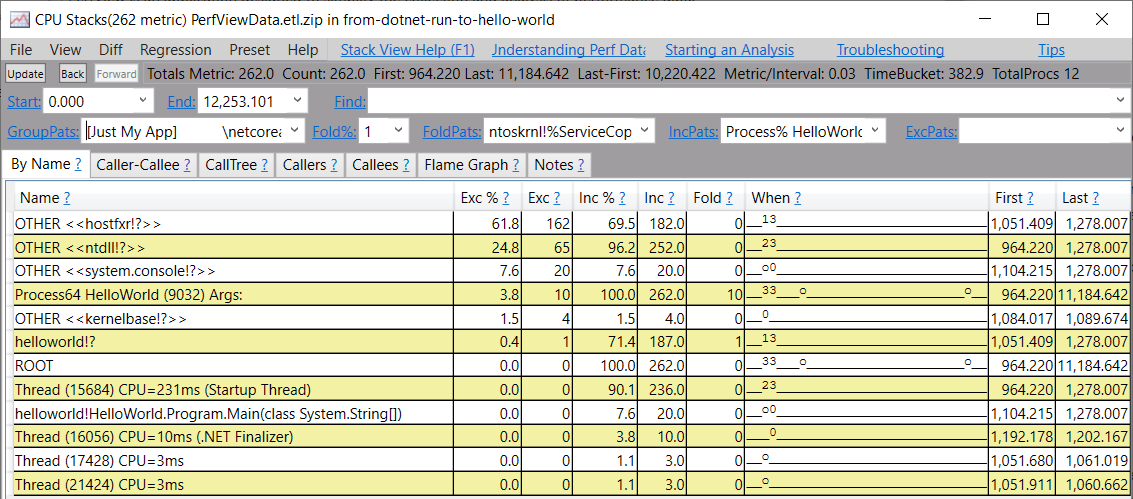
Once you have your ‘.etl.zip’ file, double-click on it and you will see a tree-view with all the available data. Now, select ‘CPU Stacks’ and you’ll be presented with a view like this:
Notice there’s alot of ‘?’ characters in the list, this means that PerfView is not able to work out the method names as it hasn’t resolved the necessary symbols for the Runtime dlls. Lets fix that:
- Open ‘CPU Stacks’
- In the list, select the ‘HelloWorld’ process (PerfView collects data machine-wide)
- In the ‘GroupPats’ drop-down, select ‘[no grouping]’
- Optional, change the ‘Symbol Path’ from the default to something else
- In the ‘By name’ tab, hit ‘Ctrl+A’ to select all the rows
- Right-click and select ‘Lookup Symbols’ (or just hit ‘Alt+S’)
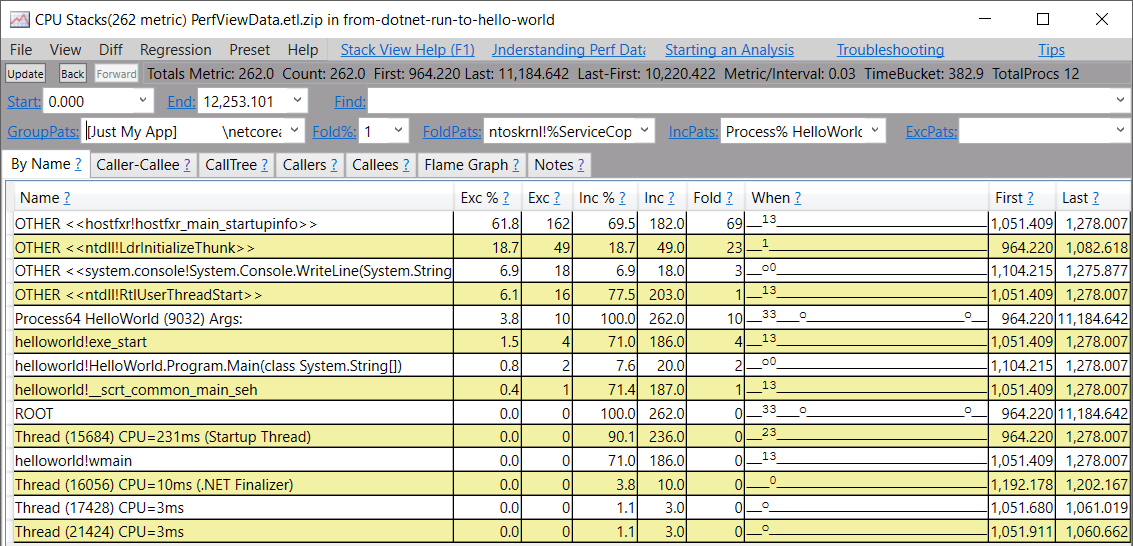
Now the ‘CPU Stacks’ view should look something like this:
Finally, we can get the data we want:
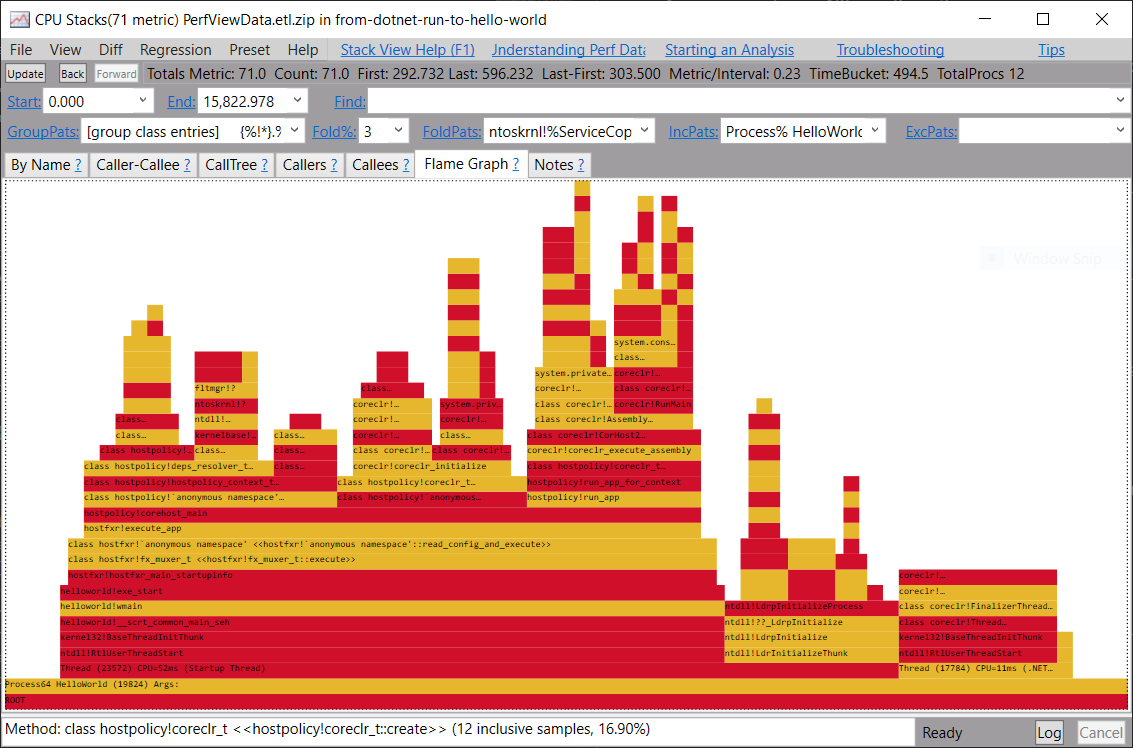
- Select the ‘Flame Graph’ tab
- Change ‘GroupPats’ to one of the following for a better flame graph:
- [group module entries] {%}!=>module $1
- [group class entries] {%!*}.%(=>class $1;{%!*}::=>class $1
- Change ‘Fold%’ to a higher number, maybe 3%, to get rid of any thin bars (any higher and you start to loose information)
Now, at this point I actually recommend exporting the PerfView data into a format that can be loaded into https://speedscope.app/ as it gives you a much better experience. To do this click File -> Save View As and then in the ‘Save as type’ box select Speed Scope Format. Once that’s done you can ‘browse’ that file at speedscope.app, or if you want you can just take a look at one I’ve already created.
Note: If you’ve never encountered ‘flamegraphs’ before, I really recommend reading this excellent explanation by Julia Evans:
perf & flamegraphs pic.twitter.com/duzWs2hoLT
— 🔎Julia Evans🔍 (@b0rk) December 26, 2017
Anaylsis of .NET Runtime Startup
Finally, we can answer our original question:
Where does the .NET Runtime spend time during start-up?
Here’s the data from the flamegraph summarised as text, with links the corresponding functions in the ‘.NET Core Runtime’ source code:
- Entire Application - 100% - 233.28ms
- Everything except
helloworld!wmain- 21% helloworld!wmain- 79% - 184.57ms
So, the main places that the runtime spends time are:
- 30% of total time is spent Launching the runtime, controlled via the ‘host policy’, which mostly takes place in
hostpolicy!create_hostpolicy_context(30% of total time) - 22% of time is spend on Initialisation of the runtime itself and the initial (and only) AppDomain it creates, this can be see in
CorHost2::Start(native) andCorHost2::CreateAppDomain(managed). For more info on this see The 68 things the CLR does before executing a single line of your code - 20% was used JITting and executing the
Mainmethod in our ‘Hello World’ code sample, this started inAssembly::ExecuteMainMethodabove.
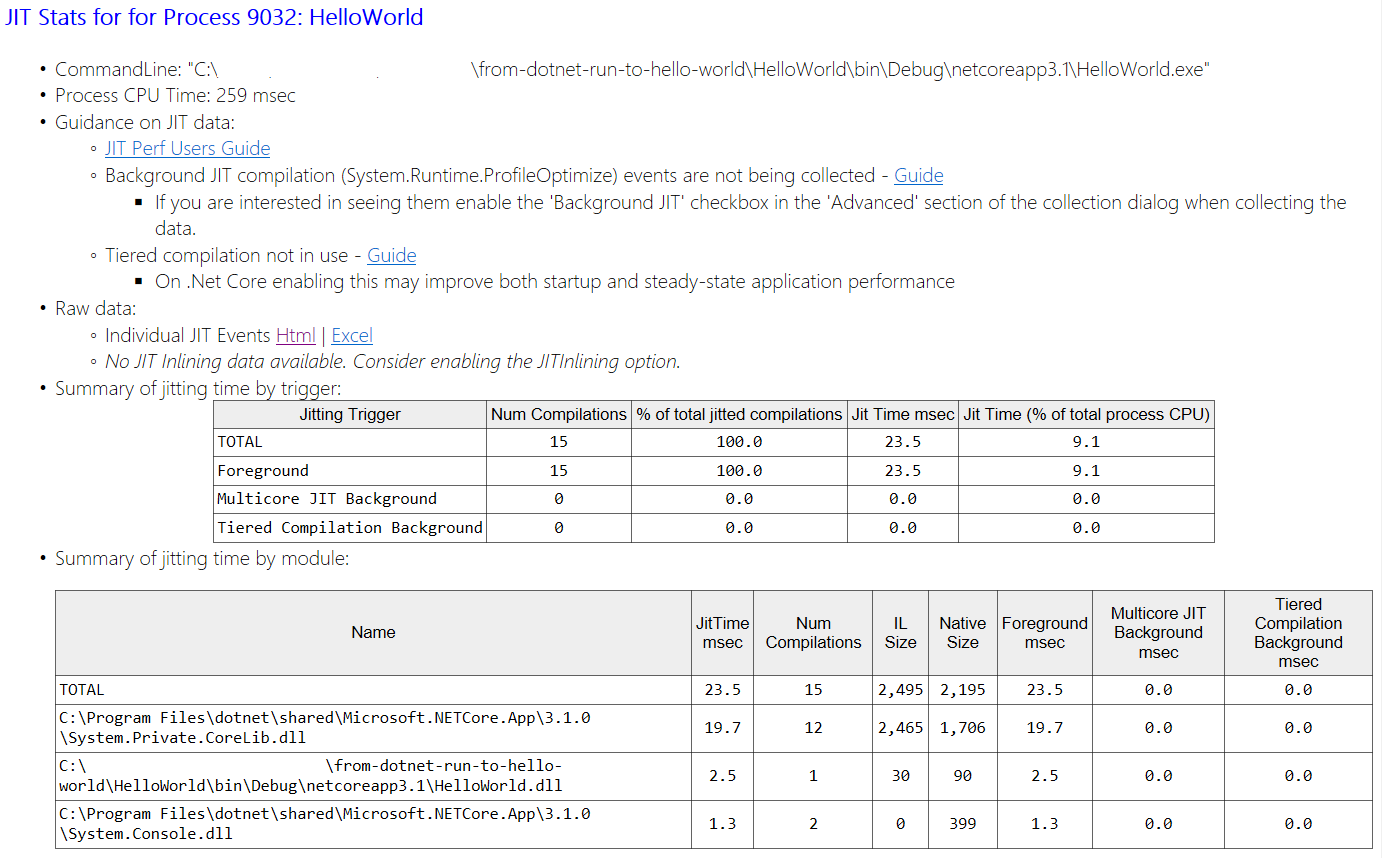
To confirm the last point, we can return to PerfView and take a look at the ‘JIT Stats Summary’ it produces. From the main menu, under ‘Advanced Group’ -> ‘JIT Stats’ we see that 23.1 ms or 9.1% of the total CPU time was spent JITing:
