Monitoring and Observability in the .NET Runtime
21 Aug 2018 - 3717 words.NET is a managed runtime, which means that it provides high-level features that ‘manage’ your program for you, from Introduction to the Common Language Runtime (CLR) (written in 2007):
The runtime has many features, so it is useful to categorize them as follows:
- Fundamental features – Features that have broad impact on the design of other features. These include:
- Garbage Collection
- Memory Safety and Type Safety
- High level support for programming languages.
- Secondary features – Features enabled by the fundamental features that may not be required by many useful programs:
- Program isolation with AppDomains
- Program Security and sandboxing
- Other Features – Features that all runtime environments need but that do not leverage the fundamental features of the CLR. Instead, they are the result of the desire to create a complete programming environment. Among them are:
- Versioning
- Debugging/Profiling
- Interoperation
You can see that ‘Debugging/Profiling’, whilst not a Fundamental or Secondary feature, still makes it into the list because of a ‘desire to create a complete programming environment’.
The rest of this post will look at what Monitoring, Observability and Introspection features the Core CLR provides, why they’re useful and how it provides them.
To make it easier to navigate, the post is split up into 3 main sections (with some ‘extra-reading material’ at the end):
- Diagnostics
- Perf View
- Common Infrastructure
- Future Plans
- Profiling
- ICorProfiler API
- Profiling v. Debugging
- Debugging
- ICorDebug API
- SOS and the DAC
- 3rd Party Debuggers
- Memory Dumps
- Further Reading
Diagnostics
Firstly we are going to look at the diagnostic information that the CLR provides, which has traditionally been supplied via ‘Event Tracing for Windows’ (ETW).
There is quite a wide range of events that the CLR provides related to:
- Garbage Collection (GC)
- Just-in-Time (JIT) Compilation
- Module and AppDomains
- Threading and Lock Contention
- and much more
For example this is where the AppDomain Load event is fired, this is the Exception Thrown event and here is the GC Allocation Tick event.
Perf View
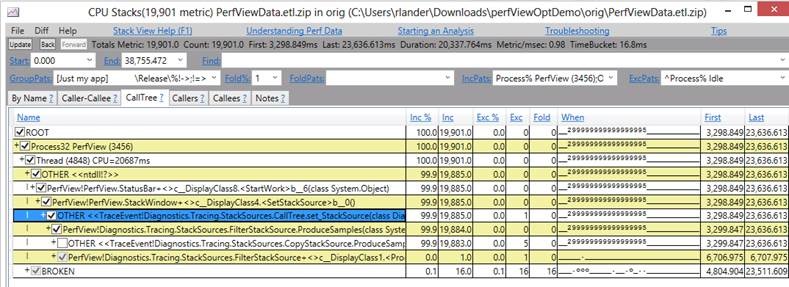
If you want to see the ETW Events coming from your .NET program I recommend using the excellent PerfView tool and starting with these PerfView Tutorials or this excellent talk PerfView: The Ultimate .NET Performance Tool. PerfView is widely regarded because it provides invaluable information, for instance Microsoft Engineers regularly use it for performance investigations.
Common Infrastructure
However, in case it wasn’t clear from the name, ETW events are only available on Windows, which doesn’t really fit into the new ‘cross-platform’ world of .NET Core. You can use PerfView for Performance Tracing on Linux (via LTTng), but that is only the cmd-line collection tool, known as ‘PerfCollect’, the analysis and rich UI (which includes flamegraphs) is currently Windows only.
But if you do want to analyse .NET Performance Linux, there are some other approaches:
The 2nd link above discusses the new ‘EventPipe’ infrastructure that is being worked on in .NET Core (along with EventSources & EventListeners, can you spot a theme!), you can see its aims in Cross-Platform Performance Monitoring Design. At a high-level it will provide a single place for the CLR to push ‘events’ related to diagnostics and performance. These ‘events’ will then be routed to one or more loggers which may include ETW, LTTng, and BPF for example, with the exact logger being determined by which OS/Platform the CLR is running on. There is also more background information in .NET Cross-Plat Performance and Eventing Design that explains the pros/cons of the different logging technologies.
All the work being done on ‘Event Pipes’ is being tracked in the ‘Performance Monitoring’ project and the associated ‘EventPipe’ Issues.
Future Plans
Finally, there are also future plans for a Performance Profiling Controller which has the following goal:
The controller is responsible for control of the profiling infrastructure and exposure of performance data produced by .NET performance diagnostics components in a simple and cross-platform way.
The idea is for it to expose the following functionality via a HTTP server, by pulling all the relevant data from ‘Event Pipes’:
REST APIs
- Pri 1: Simple Profiling: Profile the runtime for X amount of time and return the trace.
- Pri 1: Advanced Profiling: Start tracing (along with configuration)
- Pri 1: Advanced Profiling: Stop tracing (the response to calling this will be the trace itself)
- Pri 2: Get the statistics associated with all EventCounters or a specified EventCounter.
Browsable HTML Pages
- Pri 1: Textual representation of all managed code stacks in the process.
- Provides an snapshot overview of what’s currently running for use as a simple diagnostic report.
- Pri 2: Display the current state (potentially with history) of EventCounters.
- Provides an overview of the existing counters and their values.
- OPEN ISSUE: I don’t believe the necessary public APIs are present to enumerate EventCounters.
I’m excited to see where the ‘Performance Profiling Controller’ (PPC?) goes, I think it’ll be really valuable for .NET to have this built-in to the CLR, it’s something that other runtimes have.
Profiling
Another powerful feature the CLR provides is the Profiling API, which is (mostly) used by 3rd party tools to hook into the runtime at a very low-level. You can find our more about the API in this overview, but at a high-level, it allows your to wire up callbacks that are triggered when:
- GC-related events happen
- Exceptions are thrown
- Assemblies are loaded/unloaded
- much, much more
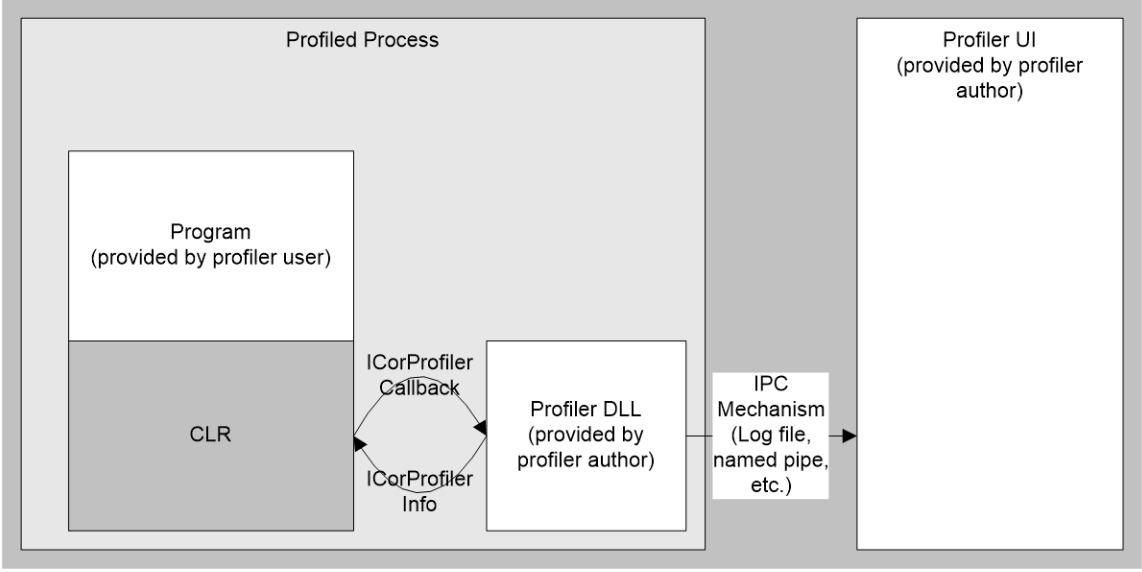
Image from the BOTR page Profiling API – Overview
In addition is has other very power features. Firstly you can setup hooks that are called every time a .NET method is executed whether in the runtime or from users code. These callbacks are known as ‘Enter/Leave’ hooks and there is a nice sample that shows how to use them, however to make them work you need to understand ‘calling conventions’ across different OSes and CPU architectures, which isn’t always easy. Also, as a warning, the Profiling API is a COM component that can only be accessed via C/C++ code, you can’t use it from C#/F#/VB.NET!
Secondly, the Profiler is able to re-write the IL code of any .NET method before it is JITted, via the SetILFunctionBody() API. This API is hugely powerful and forms the basis of many .NET APM Tools, you can learn more about how to use it in my previous post How to mock sealed classes and static methods and the accompanying code.
ICorProfiler API
It turns out that the run-time has to perform all sorts of crazy tricks to make the Profiling API work, just look at what went into this PR Allow rejit on attach (for more info on ‘ReJIT’ see ReJIT: A How-To Guide).
The overall definition for all the Profiling API interfaces and callbacks is found in \vm\inc\corprof.idl (see Interface description language). But it’s divided into 2 logical parts, one is the Profiler -> ‘Execution Engine’ (EE) interface, known asICorProfilerInfo:
// Declaration of class that implements the ICorProfilerInfo* interfaces, which allow the
// Profiler to communicate with the EE.  This allows the Profiler DLL to get
// access to private EE data structures and other things that should never be exported
// outside of the EE.
Which is implemented in the following files:
The other main part is the EE -> Profiler callbacks, which are grouped together under the ICorProfilerCallback interface:
// This module implements wrappers around calling the profiler's
// ICorProfilerCallaback* interfaces. When code in the EE needs to call the
// profiler, it goes through EEToProfInterfaceImpl to do so.
These callbacks are implemented across the following files:
- vm\eetoprofinterfaceimpl.h
- vm\eetoprofinterfaceimpl.inl
- vm\eetoprofinterfaceimpl.cpp
- vm\eetoprofinterfacewrapper.inl
Finally, it’s worth pointing out that the Profiler APIs might not work across all OSes and CPU-archs that .NET Core runs on, e.g. ELT call stub issues on Linux, see Status of CoreCLR Profiler APIs for more info.
Profiling v. Debugging
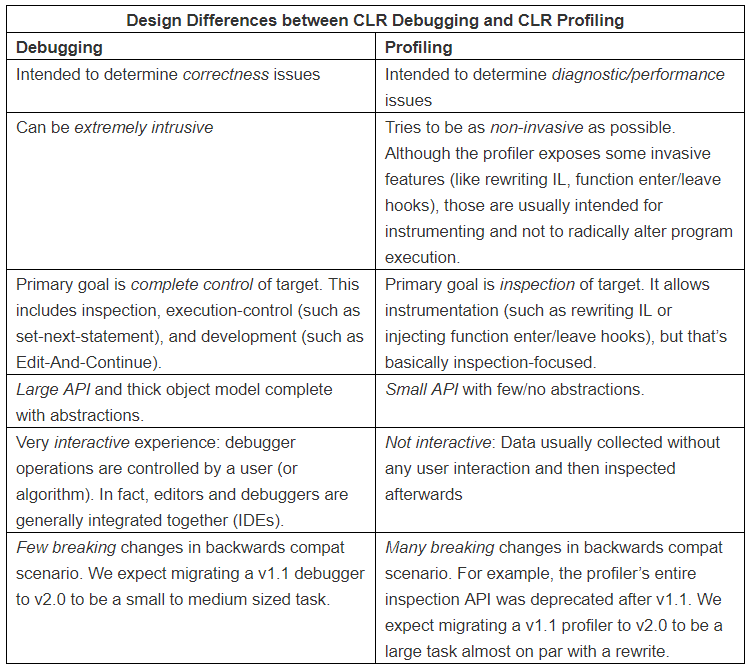
As a quick aside, ‘Profiling’ and ‘Debugging’ do have some overlap, so it’s helpful to understand what the different APIs provide in the context of the .NET Runtime, from CLR Debugging vs. CLR Profiling
Debugging
Debugging means different things to different people, for instance I asked on Twitter “what are the ways that you’ve debugged a .NET program” and got a wide range of different responses, although both sets of responses contain a really good list of tools and techniques, so they’re worth checking out, thanks #LazyWeb!
But perhaps this quote best sums up what Debugging really is 😊
Debugging is like being the detective in a crime movie where you are also the murderer.
— Filipe Fortes (@fortes) November 10, 2013
The CLR provides a very extensive range of features related to Debugging, but why does it need to provide these services, the excellent post Why is managed debugging different than native-debugging? provides 3 reasons:
- Native debugging can be abstracted at the hardware level but managed debugging needs to be abstracted at the IL level
- Managed debugging needs a lot of information not available until runtime
- A managed debugger needs to coordinate with the Garbage Collector (GC)
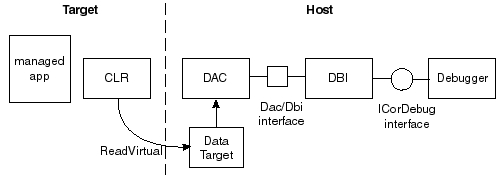
So to give a decent experience, the CLR has to provide the higher-level debugging API known as ICorDebug, which is shown in the image below of a ‘common debugging scenario’ from the BOTR:
In addition, there is a nice description of how the different parts interact in How do Managed Breakpoints work?:
Here’s an overview of the pipeline of components:
1) End-user
2) Debugger (such as Visual Studio or MDbg).
3) CLR Debugging Services (which we call "The Right Side"). This is the implementation of ICorDebug (in mscordbi.dll).
---- process boundary between Debugger and Debuggee ----
4) CLR. This is mscorwks.dll. This contains the in-process portion of the debugging services (which we call "The Left Side") which communicates directly with the RS in stage #3.
5) Debuggee's code (such as end users C# program)
ICorDebug API
But how is all this implemented and what are the different components, from CLR Debugging, a brief introduction:
All of .Net debugging support is implemented on top of a dll we call “The Dac”. This file (usually named
mscordacwks.dll) is the building block for both our public debugging API (ICorDebug) as well as the two private debugging APIs: The SOS-Dac API and IXCLR.In a perfect world, everyone would use
ICorDebug, our public debugging API. However a vast majority of features needed by tool developers such as yourself is lacking fromICorDebug. This is a problem that we are fixing where we can, but these improvements go into CLR v.next, not older versions of CLR. In fact, theICorDebugAPI only added support for crash dump debugging in CLR v4. Anyone debugging CLR v2 crash dumps cannot useICorDebugat all!
(for an additional write-up, see SOS & ICorDebug)
The ICorDebug API is actually split up into multiple interfaces, there are over 70 of them!! I won’t list them all here, but I will show the categories they fall into, for more info see Partition of ICorDebug where this list came from, as it goes into much more detail.
- Top-level: ICorDebug + ICorDebug2 are the top-level interfaces which effectively serve as a collection of ICorDebugProcess objects.
- Callbacks: Managed debug events are dispatched via methods on a callback object implemented by the debugger
- Process: This set of interfaces represents running code and includes the APIs related to eventing.
- Code / Type Inspection: Could mostly operate on a static PE image, although there are a few convenience methods for live data.
- Execution Control: Execution is the ability to “inspect” a thread’s execution. Practically, this means things like placing breakpoints (F9) and doing stepping (F11 step-in, F10 step-over, S+F11 step-out). ICorDebug’s Execution control only operates within managed code.
- Threads + Callstacks: Callstacks are the backbone of the debugger’s inspection functionality. The following interfaces are related to taking a callstack. ICorDebug only exposes debugging managed code, and thus the stacks traces are managed-only.
- Object Inspection: Object inspection is the part of the API that lets you see the values of the variables throughout the debuggee. For each interface, I list the “MVP” method that I think must succinctly conveys the purpose of that interface.
One other note, as with the Profiling APIs the level of support for the Debugging API varies across OS’s and CPU architectures. For instance, as of Aug 2018 there’s “no solution for Linux ARM of managed debugging and diagnostic”. For more info on ‘Linux’ support in general, see this great post Debugging .NET Core on Linux with LLDB and check-out the Diagnostics repository from Microsoft that has the goal of making it easier to debug .NET programs on Linux.
Finally, if you want to see what the ICorDebug APIs look like in C#, take a look at the wrappers included in CLRMD library, include all the available callbacks (CLRMD will be covered in more depth, later on in this post).
SOS and the DAC
The ‘Data Access Component’ (DAC) is discussed in detail in the BOTR page, but in essence it provides ‘out-of-process’ access to the CLR data structures, so that their internal details can be read from another process. This allows a debugger (via ICorDebug) or the ‘Son of Strike’ (SOS) extension to reach into a running instance of the CLR or a memory dump and find things like:
- all the running threads
- what objects are on the managed heap
- full information about a method, including the machine code
- the current ‘stack trace’
Quick aside, if you want an explanation of all the strange names and a bit of a ‘.NET History Lesson’ see this Stack Overflow answer.
The full list of SOS Commands is quite impressive and using it along-side WinDBG allows you a very low-level insight into what’s going on in your program and the CLR. To see how it’s implemented, lets take a look at the !HeapStat command that gives you a summary of the size of different Heaps that the .NET GC is using:
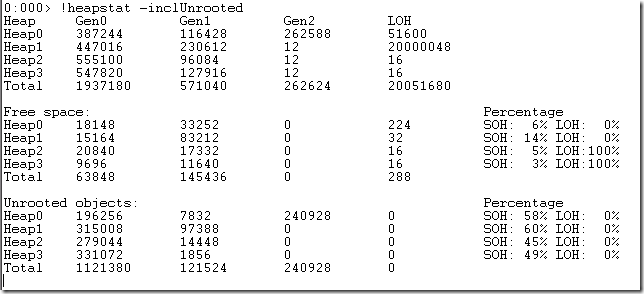
(image from SOS: Upcoming release has a few new commands – HeapStat)
Here’s the code flow, showing how SOS and the DAC work together:
- SOS The full
!HeapStatcommand (link) - SOS The code in the
!HeapStatcommand that deals with the ‘Workstation GC’ (link) - SOS
GCHeapUsageStats(..)function that does the heavy-lifting (link) - Shared The
DacpGcHeapDetailsdata structure that contains pointers to the main data in the GC heap, such as segments, card tables and individual generations (link) - DAC
GetGCHeapStaticDatafunction that fills-out theDacpGcHeapDetailsstruct (link) - Shared the
DacpHeapSegmentDatadata structure that contains details for an individual ‘segment’ with the GC Heap (link) - DAC
GetHeapSegmentData(..)that fills-out theDacpHeapSegmentDatastruct (link)
3rd Party ‘Debuggers’
Because Microsoft published the debugging API it allowed 3rd parties to make use of the use of the ICorDebug interfaces, here’s a list of some that I’ve come across:
- Debugger for .NET Core runtime from Samsung
- The debugger provides GDB/MI or VSCode debug adapter interface and allows to debug .NET apps under .NET Core runtime.
- Probably written as part of their work of porting .NET Core to their Tizen OS
- dnSpy - “.NET debugger and assembly editor”
- A very impressive tool, it’s a ‘debugger’, ‘assembly editor’, ‘hex editor’, ‘decompiler’ and much more!
- MDbg.exe (.NET Framework Command-Line Debugger)
- Available as a NuGet package and a GitHub repo or you can download is from Microsoft.
- However, at the moment is MDBG doesn’t seem to work with .NET Core, see Port MDBG to CoreCLR and ETA for porting mdbg to coreclr for some more information.
- JetBrains ‘Rider’ allows .NET Core debugging on Windows
- Although there was some controversy due to licensing issues
- For more info, see this HackerNews thread
Memory Dumps
The final area we are going to look at is ‘memory dumps’, which can be captured from a live system and analysed off-line. The .NET runtime has always had good support for creating ‘memory dumps’ on Windows and now that .NET Core is ‘cross-platform’, the are also tools available do the same on other OSes.
One of the issues with ‘memory dumps’ is that it can be tricky to get hold of the correct, matching versions of the SOS and DAC files. Fortunately Microsoft have just released the dotnet symbol CLI tool that:
can download all the files needed for debugging (symbols, modules, SOS and DAC for the coreclr module given) for any given core dump, minidump or any supported platform’s file formats like ELF, MachO, Windows DLLs, PDBs and portable PDBs.
Finally, if you spend any length of time analysing ‘memory dumps’ you really should take a look at the excellent CLR MD library that Microsoft released a few years ago. I’ve previously written about what you can do with it, but in a nutshell, it allows you to interact with memory dumps via an intuitive C# API, with classes that provide access to the ClrHeap, GC Roots, CLR Threads, Stack Frames and much more. In fact, aside from the time needed to implemented the work, CLR MD could implement most (if not all) of the SOS commands.
But how does it work, from the announcement post:
The ClrMD managed library is a wrapper around CLR internal-only debugging APIs. Although those internal-only APIs are very useful for diagnostics, we do not support them as a public, documented release because they are incredibly difficult to use and tightly coupled with other implementation details of the CLR. ClrMD addresses this problem by providing an easy-to-use managed wrapper around these low-level debugging APIs.
By making these APIs available, in an officially supported library, Microsoft have enabled developers to build a wide range of tools on top of CLRMD, which is a great result!
So in summary, the .NET Runtime provides a wide-range of diagnostic, debugging and profiling features that allow a deep-insight into what’s going on inside the CLR.
Discuss this post on HackerNews, /r/programming or /r/csharp
Further Reading
Where appropriate I’ve included additional links that covers the topics discussed in this post.
General
- Monitoring and Observability
- Monitoring and Observability — What’s the Difference and Why Does It Matter?
ETW Events and PerfView:
- ETW - Monitor Anything, Anytime, Anywhere (pdf) by Dina Goldshtein
- Make ETW Great Again (pdf)
- Logging Keystrokes with Event Tracing for Windows (ETW)
- PerfView is based on Microsoft.Diagnostics.Tracing.TraceEvent, which means you can easily write code to collect ETW events yourself, for example ‘Observe JIT Events’ sample
- More info in the TraceEvent Library Programmers Guide
- Performance Tracing on Windows
- CoreClr Event Logging Design
- Bringing .NET application performance analysis to Linux (introduction on the .NET Blog)
- Bringing .NET application performance analysis to Linux (more detailed post on the LTTng blog)
Profiling API:
- Read all of David Broman’s CLR Profiling API Blog, seriously if you want to use the Profiling API, this is the place to start!
- BOTR - Profiling - explains what the ‘Profiling API’ provides, what you can do with it and how to use it.
- BOTR - Profilability - discusses what needs to be done within the CLR ifself to make profiling possible.
- Interesting presentation The .NET Profiling API (pdf)
- Thought(s) on managed code injection and interception
- CLR 4.0 advancements in diagnostics
- Profiling: How to get GC Metrics in-process
Debugging:
- Again, if you ware serious about using the Debugging API, you mist read all of Mike Stall’s .NET Debugging Blog, great stuff, including:
- BOTR Data Access Component (DAC) Notes
- What’s New in CLR 4.5 Debugging API?
- Writing a .Net Debugger, Part 2, Part 3 and Part 4
- Writing an automatic debugger in 15 minutes (yes, a debugger!)
- PR to add SOS DumpAsync command
- Question: what remaining SOS commands need to be ported to Linux/OS X
Memory Dumps:
- Creating and analyzing minidumps in .NET production applications
- Creating Smaller, But Still Usable, Dumps of .NET Applications and More on - MiniDumper: Getting the Right Memory Pages for .NET Analysis
- Minidumper – A Better Way to Create Managed Memory Dumps
- ClrDump is a set of tools that allow to produce small minidumps of managed applications