Analysing .NET Memory Dumps with CLR MD
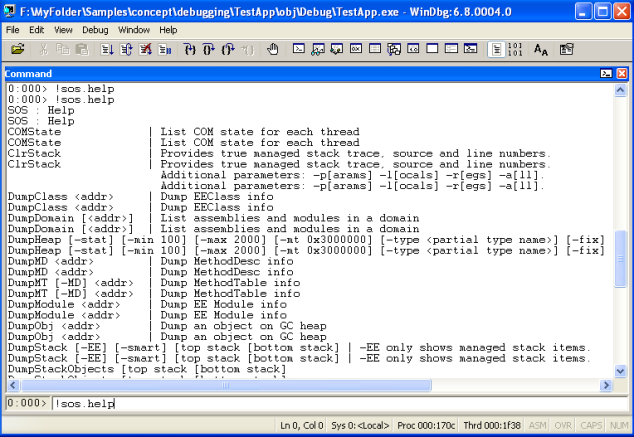
06 Sep 2016 - 1053 wordsIf you’ve ever spent time debugging .NET memory dumps in WinDBG you will be familiar with the commands shown below, which aren’t always the most straight-forward to work with!
However back in May 2013 Microsoft released the CLR MD library, describing it as:
… a set of advanced APIs for programmatically inspecting a crash dump of a .NET program much in the same way as the SOS Debugging Extensions (SOS). It allows you to write automated crash analysis for your applications and automate many common debugger tasks.
This post explores some of the things you can achieve by instead using CLR MD, a C# library which is now available as a NuGet Package. If you’re interested the full source code for all the examples is available.
Getting started with CLR MD
This post isn’t meant to serve as a Getting Started guide, there’s already a great set of Tutorials linked from project README that serve that purpose:
- Getting Started - A brief introduction to the API and how to create a CLRRuntime instance.
- The CLRRuntime Object - Basic operations like enumerating AppDomains, Threads, the Finalizer Queue, etc.
- Walking the Heap - Walking objects on the GC heap, working with types in CLR MD.
- Types and Fields in CLRMD - More information about dealing with types and fields in CLRMD.
- Machine Code in CLRMD - Getting access to the native code produced by the JIT or NGEN
However we will be looking at what else CLR MD allows you to achieve.
Detailed GC Heap Information
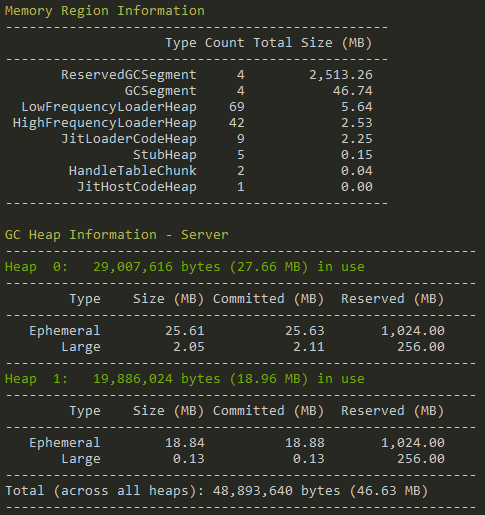
I’ve previously written about the Garbage Collectors, so the first thing that we’ll do is see what GC related information we can obtain. The .NET GC creates 1 or more Heaps, depending on the number of CPU cores available and the mode it is running in (Server/Workstation). These heaps are in-turn made up of several Segments, for the different Generations (Gen0/Ephememral, Gen1, Gen2 and Large). Finally it’s worth pointing out that the GC initially Reserves the memory it wants, but only Commits it when it actually needs to. So using the code shown here, we can iterate through the different GC Heaps, printing out the information about their individual Segments as we go:
Analysing String usage
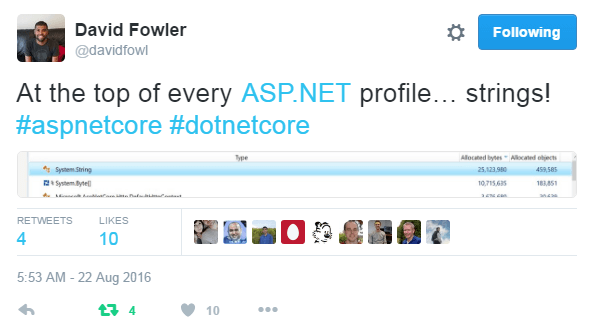
But knowing what’s inside those heaps is more useful, as David Fowler nicely summed up in a tweet, strings often significantly contribute to memory usage:
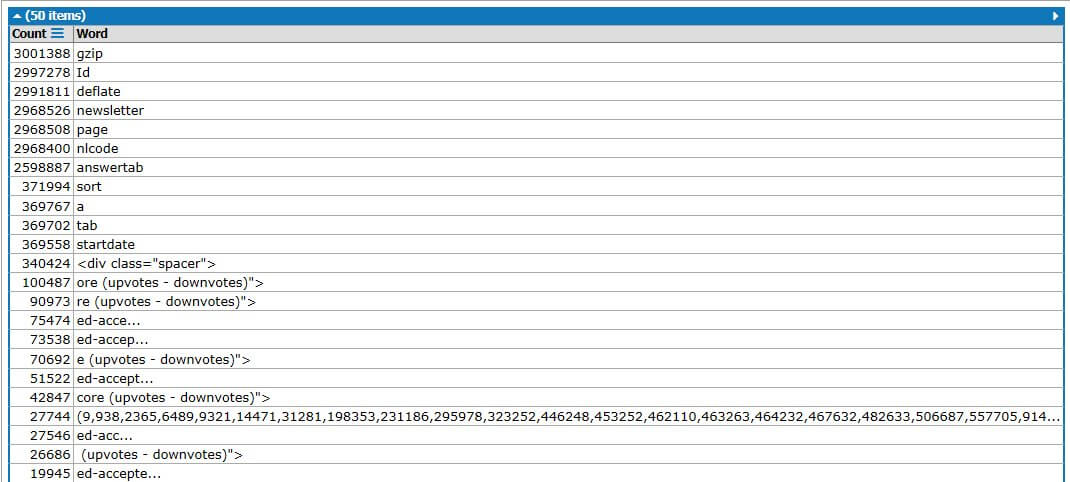
Now we could analyse the memory dump to produce a list of the most frequently occurring strings, as Nick Craver did with a memory dump from the App Pool of a Stack Overflow server (click for larger image):
However we’re going to look more closely at the actual contents of the string and in-particular analyse what the underlying encoding is, i.e. ASCII, ISO-8859-1 (Latin-1) or Unicode.
By default the .NET string Encoder, instead of giving an error, replaces any characters it can’t convert with ‘�’ (which is known as the Unicode Replacement Character). So we will need to force it to throw an exception. This means we can detect the most compact encoding possible, by trying to convert to the raw string data to ASCII, ISO-8859-1 (Latin-1) and then Unicode (sequence of UTF-16 code units) in turn. To see this in action, below is the code from the IsASCII(..) function:
private static Encoding asciiEncoder = Encoding.GetEncoding(
        Encoding.ASCII.EncodingName,
        EncoderFallback.ExceptionFallback,
        DecoderFallback.ExceptionFallback);

private static bool IsASCII(string text, out byte[] textAsBytes)
{
    var unicodeBytes = Encoding.Unicode.GetBytes(text);
    try
    {
        textAsBytes = Encoding.Convert(Encoding.Unicode, asciiEncoder, unicodeBytes);
        return true;
    }
    catch (EncoderFallbackException /*efEx*/)
    {
        textAsBytes = null;
        return false;
    }
}
Next we run this on a memory dump of Visual Studio with the HeapStringAnalyser source code solution loaded and get the following output:
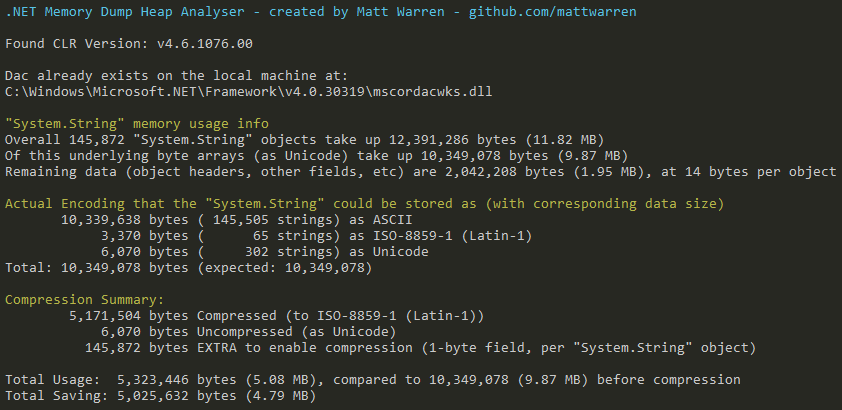
The most interesting part is reproduced below:
Overall 145,872 "System.String" objects take up 12,391,286 bytes (11.82 MB)
Of this underlying byte arrays (as Unicode) take up 10,349,078 bytes (9.87 MB)
Remaining data (object headers, other fields, etc) are 2,042,208 bytes (1.95 MB), at 14 bytes per object

Actual Encoding that the "System.String" could be stored as (with corresponding data size)
       10,339,638 bytes ( 145,505 strings) as ASCII
            3,370 bytes (      65 strings) as ISO-8859-1 (Latin-1)
            6,070 bytes (     302 strings) as Unicode
Total: 10,349,078 bytes
So in this case we can see that out of the 145,872 string objects in memory, 145,505 of them could actually be stored as ASCII, a further 65 as ISO-8859-1 (Latin-1) and only 302 need the full Unicode encoding.
Additional resources
Hopefully this post has demonstrated that CLR MD is a powerful tool, if you want to find out more please refer to the links below:
- Traversing the GC Heap with ClrMd
- msos - Command-line environment a-la WinDbg for executing SOS commands without having SOS available
- .NET Crash Dump and Live Process Inspection
- ClrMD.Extensions
- Get most duplicated strings from a heap dump using ClrMD
- Dumpty - A Dump tool for .Net.
- How to properly work with non-primitive ClrInstanceField values using ClrMD?