Open Source .NET – 4 years later
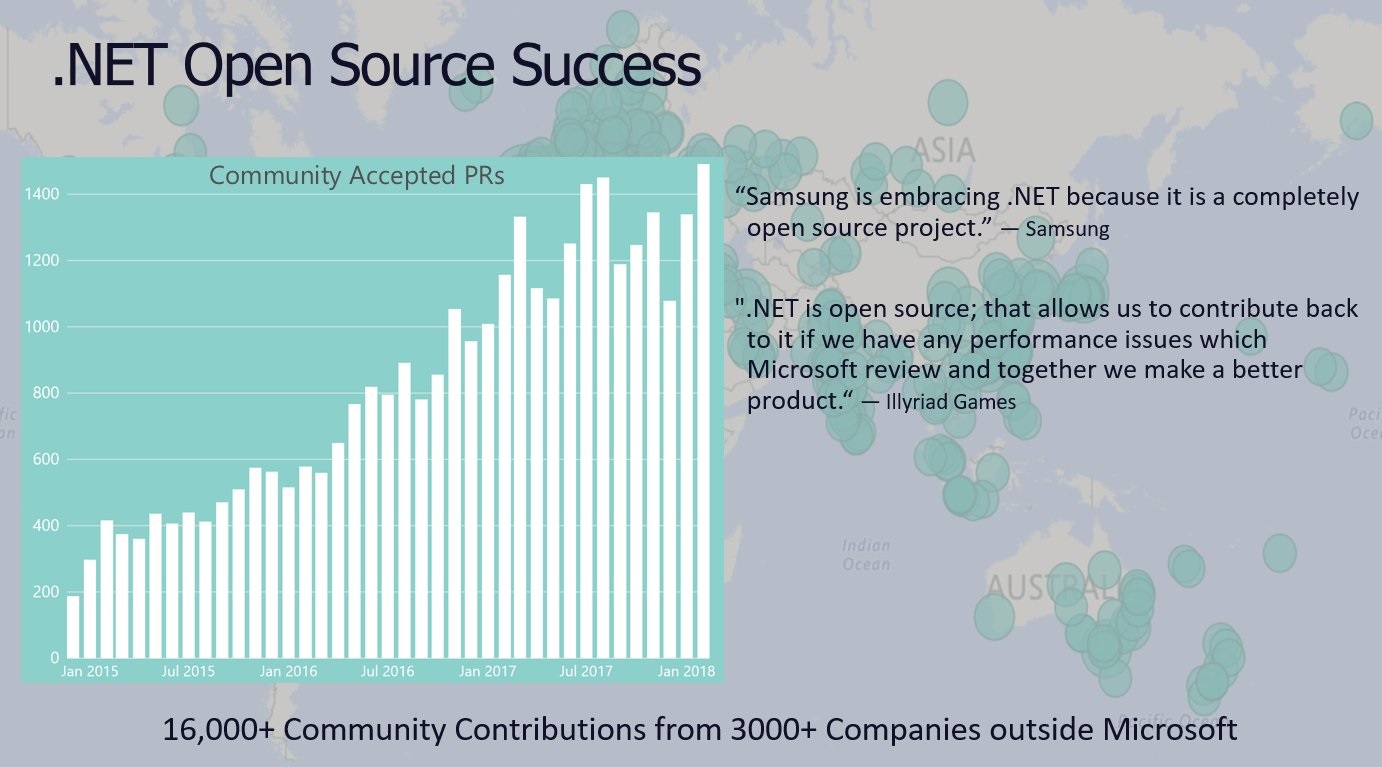
04 Dec 2018 - 1302 wordsA little over 4 years ago Microsoft announced that they were open sourcing large parts of the .NET framework and as this slide from New Features in .NET Core and ASP.NET Core 2.1 shows, the community has been contributing in a significant way:
Side-note: This post forms part of an on-going series, if you want to see how things have changed over time you can check out the previous ones:
- Open Source .NET – 3 years later
- Open Source .NET – 2 years later
- Open Source .NET – 1 year later - Now with ASP.NET
- Open Source .NET – 1 year later
Runtime Changes
Before I look at the numbers, I just want to take a moment to look at the significant runtime changes that have taken place over the last 4 years. Partly because I really like looking at the ‘Internals’ of CoreCLR, but also because the runtime is the one repository that makes all the others possible, they rely on it!
To give some context, here’s the slides from a presentation I did called ‘From ‘dotnet run’ to ‘hello world’. If you flick through them you’ll see what components make up the CoreCLR code-base and what they do to make your application run.
So, after a bit of digging through the 19,059 commits, 5,790 issues and the 8 projects, here’s the list of significant changes in the .NET Core Runtime (CoreCLR) over the last few years (if I’ve missed any out, please let me know!!):
Span<T>(more info)- Span<T> (‘umbrella’ issue for the whole feature)
- Includes change to multiple parts of the runtime, the VM, JIT and GC
- Will .NET Core 2.1’s Span-based APIs be made available on the .NET Framework? If so, when?
- Also needed CoreFX work such as Add initial Span/Buffer-based APIs across corefx and String-like extension methods to ReadOnlySpan<char> Epic and Compiler changes, e.g. Compile time enforcement of safety for ref-like types
- Span<T> (‘umbrella’ issue for the whole feature)
ref-likelike types (to supportSpan<T>)- Tiered Compilation (more info)
- Cross-platform (Unix, OS X, etc, see list of all ‘os-xxx’ labels)
- New CPU Architectures
- ARM64 Project
- ARM32 Project
- List of all issues labelled ‘arch-xxx’
- Hardware Intrinsics (project)
- Design Document
- Using .NET Hardware Intrinsics API to accelerate machine learning scenarios contains a nice overview of the implementation
- Default Interface Methods (project)
- Runtime support for the default interface methods C# language feature.
- Performance Monitoring and Diagnostics (project)
- Ready-to-Run Images
- ReadyToRun Overview
- Bing.com runs on .NET Core 2.1! (section on ‘ReadyToRun Images’)
- LocalGC (project)
- See in in action in Zero Garbage Collector for .NET Core and the follow-up Zero Garbage Collector for .NET Core 2.1 and ASP.NET Core 2.1
- Unloadability (project)
- Support for unloading AssemblyLoadContext and all assemblies loaded into it.
So there’s been quite a few large, fundamental changes to the runtime since it’s been open-sourced.
Repository activity over time
But onto the data, first we are going to look at an overview of the level of activity in each repo, by analysing the total number of ‘Issues’ (created) or ‘Pull Requests’ (closed) per month. (Sparklines FTW!!). If you are interested in how I got the data, see the previous post because the process is the same.
Note: Numbers in black are from the most recent month, with the red dot showing the lowest and the green dot the highest previous value. You can toggle between Issues and Pull Requests by clicking on the buttons, hover over individual sparklines to get a tooltip showing the per/month values and click on the project name to take you to the GitHub page for that repository.
This data gives a good indication of how healthy different repos are, are they growing over time, or staying the same. You can also see the different levels of activity each repo has and how they compare to other ones.
Whilst it’s clear that Visual Studio Code is way ahead of all the other repos (in ‘# of Issues’), it’s interesting to see that some of the .NET-only ones are still pretty large, notably CoreFX (base-class libraries), Roslyn (compiler) and CoreCLR (runtime).
Overall Participation - Community v. Microsoft
Next will will look at the total participation from the last 4 years, i.e. November 2014 to November 2018. All Pull Requests and Issues are treated equally, so a large PR counts the same as one that fixes a speling mistake. Whilst this isn’t ideal it’s the simplest way to get an idea of the Microsoft/Community split. In addition, Community does include people paid by other companies to work on .NET Projects, for instance Samsung Engineers.
Note: You can hover over the bars to get the actual numbers, rather than percentages.
Participation over time - Community v. Microsoft
Finally we can see the ‘per-month’ data from the last 4 years, i.e. November 2014 to November 2018.
Note: You can inspect different repos by selecting them from the pull-down list, but be aware that the y-axis on the graphs are re-scaled, so the maximum value will change each time.
Summary
It’s clear that the community continues to be invested in the .NET-related, Open Source repositories, contributing significantly and for a sustained period of time. I think this is good for all .NET developers, whether you contribute to OSS or not, having .NET be a thriving, Open Source product has many benefits!
