Preventing .NET Garbage Collections with the TryStartNoGCRegion API
16 Aug 2016 - 1866 wordsPauses are a known problem in runtimes that have a Garbage Collector (GC), such as Java or .NET. GC Pauses can last several milliseconds, during which your application is blocked or suspended. One way you can alleviate the pauses is to modify your code so that it doesn’t allocate, i.e. so the GC has nothing to do. But this can require lots of work and you really have to understand the runtime as many allocation are hidden.
Another technique is to temporarily suspend the GC, during a critical region of your code where you don’t want any pauses and then start it up again afterwards. This is exactly what the TryStartNoGCRegion API (added in .NET 4.6) allows you to do.
From the MSDN docs:
Attempts to disallow garbage collection during the execution of a critical path if a specified amount of memory is available.
TryStartNoGCRegion in Action
To see how the API works, I ran some simple tests using the .NET GC Workstation mode, on a 32-bit CPU. The test simply call TryStartNoGCRegion and then verify how much memory can be allocated before a Collection happens. The code is available if you want to try it out for yourself.
Test 1: Regular allocation, TryStartNoGCRegion not called
You can see that a garbage collection happens after the 2nd allocation (indicated by “**”):
Prevent GC: False, Over Allocate: False
Allocated:   3.00 MB, Mode:  Interactive, Gen0: 0, Gen1: 0, Gen2: 0,
Allocated:   6.00 MB, Mode:  Interactive, Gen0: 1, Gen1: 1, Gen2: 1, **
Allocated:   9.00 MB, Mode:  Interactive, Gen0: 1, Gen1: 1, Gen2: 1,
Allocated:  12.00 MB, Mode:  Interactive, Gen0: 1, Gen1: 1, Gen2: 1,
Allocated:  15.00 MB, Mode:  Interactive, Gen0: 1, Gen1: 1, Gen2: 1,
Test 2: TryStartNoGCRegion(..) with size set to 15MB
Here we see that despite allocating the same amount as in the first test, no garbage collections are triggered during the run.
Prevent GC: True, Over Allocate: False
TryStartNoGCRegion: Size=15 MB (15,360 K or 15,728,640 bytes) SUCCEEDED
Allocated:   3.00 MB, Mode:   NoGCRegion, Gen0: 0, Gen1: 0, Gen2: 0,
Allocated:   6.00 MB, Mode:   NoGCRegion, Gen0: 0, Gen1: 0, Gen2: 0,
Allocated:   9.00 MB, Mode:   NoGCRegion, Gen0: 0, Gen1: 0, Gen2: 0,
Allocated:  12.00 MB, Mode:   NoGCRegion, Gen0: 0, Gen1: 0, Gen2: 0,
Allocated:  15.00 MB, Mode:   NoGCRegion, Gen0: 0, Gen1: 0, Gen2: 0,
Test 3: TryStartNoGCRegion(..) size of 15MB, but allocating more than 15MB
Finally we see that once we’ve allocated more that the size we asked for, the mode switches from NoGCRegion to Interactive and garbage collections can now happen.
Prevent GC: True, Over Allocate: True
TryStartNoGCRegion: Size=15 MB (15,360 K or 15,728,640 bytes) SUCCEEDED
Allocated:   3.00 MB, Mode:   NoGCRegion, Gen0: 0, Gen1: 0, Gen2: 0,
Allocated:   6.00 MB, Mode:   NoGCRegion, Gen0: 0, Gen1: 0, Gen2: 0,
Allocated:   9.00 MB, Mode:   NoGCRegion, Gen0: 0, Gen1: 0, Gen2: 0,
Allocated:  12.00 MB, Mode:   NoGCRegion, Gen0: 0, Gen1: 0, Gen2: 0,
Allocated:  15.00 MB, Mode:   NoGCRegion, Gen0: 0, Gen1: 0, Gen2: 0,
Allocated:  18.00 MB, Mode:   NoGCRegion, Gen0: 0, Gen1: 0, Gen2: 0,
Allocated:  21.00 MB, Mode:  Interactive, Gen0: 1, Gen1: 1, Gen2: 1, **
Allocated:  24.00 MB, Mode:  Interactive, Gen0: 1, Gen1: 1, Gen2: 1,
Allocated:  27.00 MB, Mode:  Interactive, Gen0: 2, Gen1: 2, Gen2: 2, **
Allocated:  30.00 MB, Mode:  Interactive, Gen0: 2, Gen1: 2, Gen2: 2,
So this shows that at least in the simple test we’ve done, the API works as advertised. As long as you don’t subsequently allocate more memory than you asked for, no Garbage Collections will take place.
Object Size
However there are a few caveats when using TryStartNoGCRegion, the first of which is that you are required to know up-front, the total size in bytes of the objects you will be allocating. As we’ve seen previously if you allocate more than totalSize bytes, the No GC Region will no longer be active and it will then be possible for garbage collections to happen.
It’s not straight forward to get the size of an object in .NET, it’s a managed-runtime and it tries it’s best to hide that sort of detail from you. To further complicate matters is varies depending on the CPU architecture and even the version of the runtime.
But you do have a few options:
- Guess?!
- Search on Stack Overflow
- Start-up WinDbg and use the
!objsizecommand on a memory dump of your process - Get a estimate using the technique that Jon Skeet proposes
- Use DotNetEx, which relies on inspecting the internal fields of the CLR object
Personally I would go with a variation of 3), use WinDbg, but automate it using the excellent CLRMD C# library.
Segment Size
Update: It turns out that I completely missed the section on segment sizes on the MSDN page, thanks to Maoni for pointing this out to me. In the section on “Generations” there is the following chart (which fortunately correlates with my findings below):
.png)
However even when you know how many bytes will be allocated within the No GC Region, you still need to ensure that it’s less that the maximum amount allowed, because if you specify a value too large an ArgumentOutOfRangeException exception is thrown. From the MSDN docs (emphasis mine):
The amount of memory in bytes to allocate without triggering a garbage collection. It must be less than or equal to the size of an ephemeral segment. For information on the size of an ephemeral segment, see the “Ephemeral generations and segments” section in the Fundamentals of Garbage Collection article.
However if you visit the linked article on GC Fundamentals, it has no exact figure for the size of an ephemeral segment, it does however have this stark warning:
Important The size of segments allocated by the garbage collector is implementation-specific and is subject to change at any time, including in periodic updates. Your app should never make assumptions about or depend on a particular segment size, nor should it attempt to configure the amount of memory available for segment allocations.
Excellent, that’s very helpful!?
So let me get this straight, to prevent TryStartNoGCRegion from throwing an exception, we have to pass in a totalSize value that isn’t larger than the size of an ephemeral segment, but we’re not allowed to know the actual value of an ephemeral segment, in-case we assume too much!!
So where does that leave us?
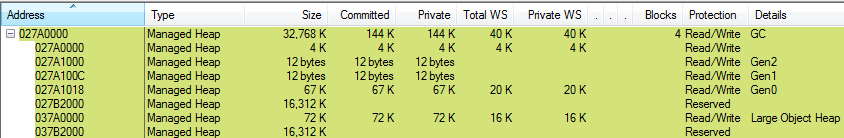
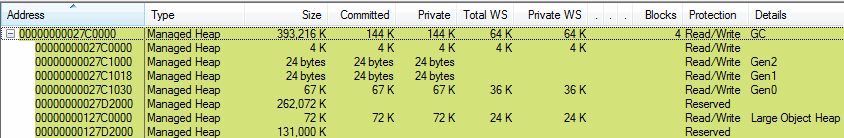
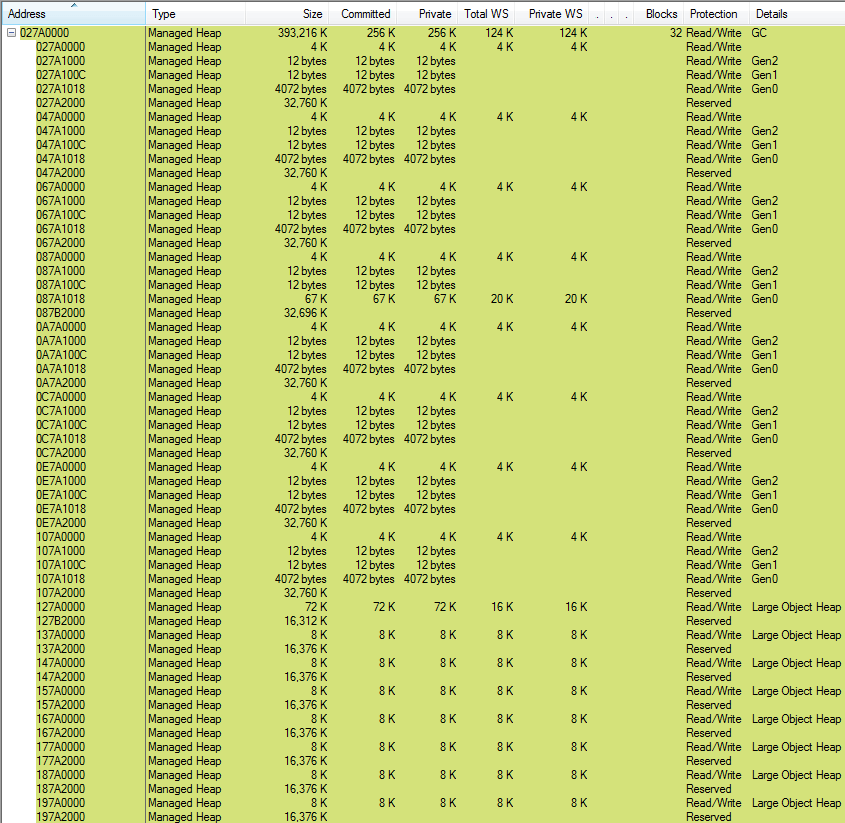
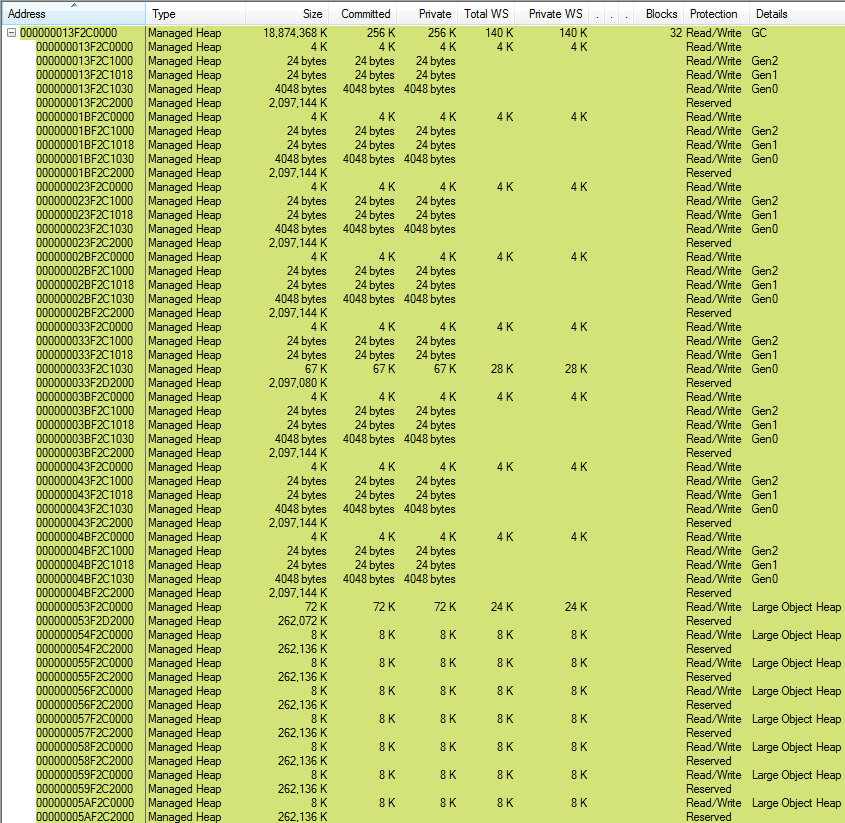
Well fortunately it’s possible to figure out the size of an ephemeral or Small Object Heap (SOH) segment using either VMMap, or the previously mentioned CLRMD library (code sample available).
Here are the results I got with the .NET Framework 4.6.1, running on a 4 Core (HT) - Intel® Core™ i7-4800MQ, i.e. Environment.ProcessorCount = 8. If you click on the links for each row heading, you can see the full breakdown as reported by VMMap.
| GC Mode | CPU Arch | SOH Segment | LOH Segment | Initial GC Size | Largest No GC Region totalSize value |
|---|---|---|---|---|---|
| Workstation | 32-bit | 16 MB | 16 MB | 32 MB | 16 MB |
| Workstation | 64-bit | 256 MB | 128 MB | 384 MB | 244 MB |
| Server | 32-bit | 32 MB | 16 MB | 384 MB | 256 MB |
| Server | 64-bit | 2,048 MB | 256 MB | 18,423 MB | 16,384 MB |
The final column is the largest totalSize value that can be passed into TryStartNoGCRegion(long totalSize), this was found by experimentation/trial-and-error.
Note: The main difference between Server and Workstation is that in Workstation mode there is only one heap, whereas in Server mode there is one heap per logical CPU.
TryStartNoGCRegion under-the-hood
What’s nice is that the entire feature is in a single Github commit, so it’s easy to see what code changes were made:
Around half of the files modified (listed below) are the changes needed to set-up the plumbing and error handling involved in adding a API to the System.GC class, they also give an interesting overview of what’s involved in having the external C# code talk to the internal C++ code in the CLR (click on a link to go directly to the diff):
- src/mscorlib/src/System/GC.cs
- src/mscorlib/src/System/Runtime/GcSettings.cs
- src/vm/comutilnative.cpp
- src/vm/comutilnative.h
- src/vm/ecalllist.h
The rest of the changes are where the actual work takes place, with all the significant heavy-lifting happening in gc.cpp:
TryStartNoGCRegion Implementation
When you call TryStartNoGCRegion the following things happen:
- The maximum required heap sizes are calculated based on the
totalSizeparameter passed in. These calculations take place in gc_heap::prepare_for_no_gc_region - If the current heaps aren’t large enough to accommodate the new value, they are re-sized. To achieve this a full collection is triggered (see GCHeap::StartNoGCRegion)
Note: Due to the way the GC uses segments, it won’t always allocate memory. It will however ensure that it reserves the maximum amount of memory required, so that it can be committed when actually needed.
Then next time the GC wants to perform a collection it checks:
- Is the current mode set to No GC Region
- By checking
gc_heap::settings.pause_mode == pause_no_gc, relevant code here
- By checking
- Can we stay in the No GC Region mode
- This is done by calling gc_heap::should_proceed_for_no_gc(), which performs a sanity-check to ensure that we haven’t allocated more than the # of bytes we asked for when
TryStartNoGCRegionwas set-up
- This is done by calling gc_heap::should_proceed_for_no_gc(), which performs a sanity-check to ensure that we haven’t allocated more than the # of bytes we asked for when
If 1) and 2) are both true then a collection does not take place because the GC knows that it has already reserved enough memory to fulfil future allocations, so it doesn’t need to clean-up up any existing garbage to make space.