Coz: Finding Code that Counts with Causal Profiling - An Introduction
30 Mar 2016 - 1175 wordsA while ago I came across an interesting and very readable paper titled “COZ Finding Code that Counts with Causal Profiling” that was presented at SOSP 2015 (and was recipient of a Best Paper Award). This post is my attempt to provide an introduction to Causal Profiling for anyone who doesn’t want to go through the entire paper.
What is “Causal Profiling”
Here’s the explanation from the paper itself:
Unlike past profiling approaches, causal profiling indicates exactly where programmers should focus their optimization efforts, and quantifies their potential impact. Causal profiling works by running performance experiments during program execution. Each experiment calculates the impact of any potential optimization by virtually speeding up code: inserting pauses that slow down all other code running concurrently. The key insight is that this slowdown has the same relative effect as running that line faster, thus “virtually” speeding it up.
Or if you prefer, below is an image from the paper explaining what it does (click to enlarge)
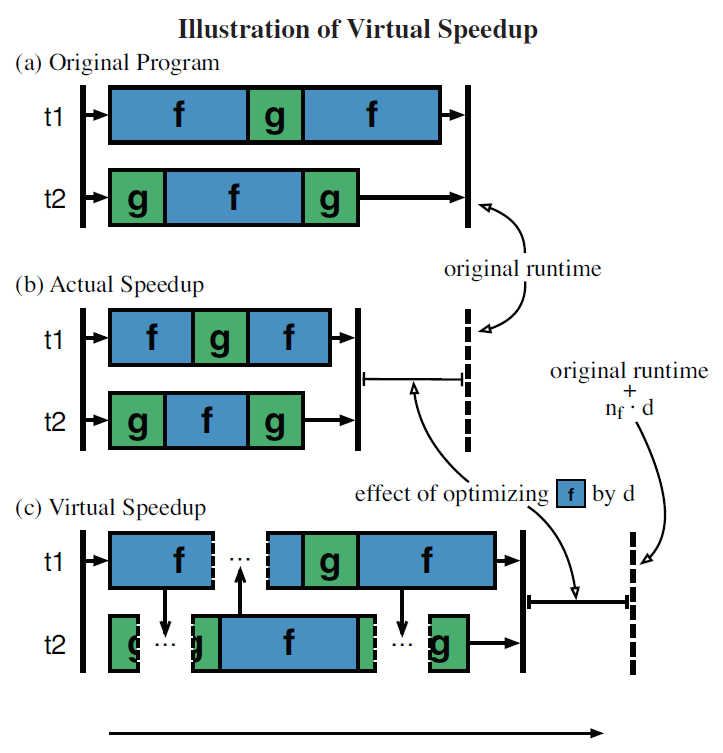
The key part is that it tries to find the effect of speeding up a given block of code on the overall running time of the program. But being able to speed up arbitrary pieces of code is very hard and if the authors could do that, then then would be better off making lots of money selling code optimisation tools. So instead of speeding up a given piece of code, they artificially slow-down all the other code that is running at the same time, which has exactly the same relative effect.
In the diagram above Coz is trying to determine the effect that optimising the code in block f would have on the overall runtime. Instead of making f run quicker, as shown in part (b), they instead make g run slower by inserting pauses, see part (c). Then Coz is able to infer that the speed-up seen in (c) will have the same relative effect if f was to run faster, therefore the “Actual Speedup” as shown in (b) is possible.
Unfortunately Coz doesn’t tell you how to speed up your code, that’s left up to you, but it does tell you which parts of the code you should focus on to get the best overall improvements. Or another way of saying it is, Coz tells you:
If you speed up a given block of code by this much, the program will run this much faster
Existing profilers
In the paper, the authors argue that existing profilers only tell you about:
- Frequently executed code (# of calls)
- Code that runs for a long time (% of total time)
What they don’t help you with is finding important code in parallel programs and this is the problem that Coz solves. The (contrived) example they give is:
void a() { // ˜6.7 seconds
    for(volatile size_t x=0; x<2000000000; x++) {}
}

void b() { // ˜6.4 seconds
    for(volatile size_t y=0; y<1900000000; y++) {}
}

int main() {
    // Spawn both threads and wait for them.
    thread a_thread(a), b_thread(b);
    a_thread.join(); b_thread.join();
}
which they state is a:
.. simple multi-threaded program that illustrates the shortcomings of existing profilers. Optimizing f
awill improve performance by no more than 4.5%, while optimizing fbwould have no effect on performance.
As shown in the comparison below (click for larger version), a regular profiler shows that fa and fb both comprise similar fractions of the total runtime (55.20% and 45.19% respectively). However by using a Causal Profiler, it predicts that optimising line 2 from fa will increase the overall runtime by 4-6%, whereas optimising fb will only increase it by < 2%.

Results
However their research was not only done on contrived programs, they also looked at several real-world projects including:
- SQLite
- PARSEC benchmark suite
- dedup - Next-generation compression with data deduplication
- ferred - Content similarity search server
Results taken from a presentation by Charlie Curtsinger (one of the authors of Coz) show that there are several situations where Coz identifies an area for optimisation that a conventional profiler would miss. For instance they identified a function in SQLite that when optimised provided a 25% speed-up, however very little time was actually spent in the function, only 0.15%, so it would not have shown up in the output from a conventional profiler.
| Project | Speedup with Coz | % Runtime reported via a Profiler |
|---|---|---|
| SQLite | 25% | 0.15% |
| dedup | 9% | 14.38% |
| ferred | 21% | 0.00% |
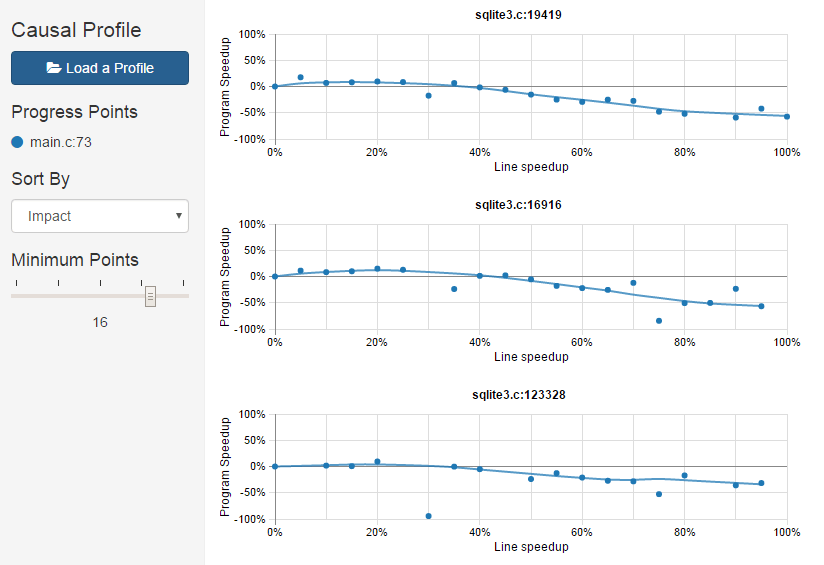
You can explore these results in the interactive viewer that has been developed alongside the tool. For instance the image below shows the lines on code in the SQLite source base that Coz identifies as having the maximum impact, positive or negative (click for full-size version):
Summary
It’s worth pointing out that Coz is currently a prototype causal profiler, that at the moment only runs on Linux, but doesn’t require you to modify your executable. However the ideas presented in the paper could be ported to other OSes, programming languages or runtimes. For instance work has already begun on a Go version that only required a few modifications to the runtime to get a prototype up and running.
It would be great to see something like this for .NET, any takers?
Further Information
If you want to find out any more information about Coz, here is a list of useful links:
- The Coz paper “Finding Code that Counts with Causal Profiling”
- Comprehensive (and more in-depth) write-up on the paper from “the morning paper” blog
- Coz GitHub repository
- Presentation by Charlie Curtsinger (one of the authors of Coz)
- Causal Profiling for Go is an attempt to implement Coz within the Go runtime