Adventures in Benchmarking - Memory Allocations
17 Feb 2016 - 1858 wordsFor a while now I’ve been involved in the Open Source BenchmarkDotNet library along with Andrey Akinshin the project owner. Our goal has been to produce a .NET Benchmarking library that is:
- Accurate
- Easy-to-use
- Helpful
First and foremost we do everything we can to ensure that BenchmarkDotNet gives you accurate measurements, everything else is just “sprinkles on the sundae”. That is, without accurate measurements, a benchmarking library is pretty useless, especially one that displays results in nanoseconds.
But once point 1) has been dealt with, 2) it a bit more subjective. Using BenchmarkDotNet involves little more than adding a [Benchmark] attribute to your method and then running it as per the Step-by-step guide in the GitHub README. I’ll let you decide if that is easy-to-use or not, but again it’s something we strive for. Once you’re done with the “Getting Started” guide, there is also a complete set of Tutorial Benchmarks available, as well as some more real-word examples for you to take a look at.
Being “Helpful”
But this post isn’t going to be a general BenchmarkDotNet tutorial, instead I’m going to focus on some of the specific tools that it gives you to diagnose what is going on in a benchmark, or to put it another way, to help you answer the question “Why is Benchmark A slower than Benchmark B?”
String Concat vs StringBuilder
Let’s start with a simple benchmark:
public class Framework_StringConcatVsStringBuilder
{
  [Params(1, 2, 3, 4, 5, 10, 15, 20)]
  public int Loops;

  [Benchmark]
  public string StringConcat()
  {
    string result = string.Empty;
    for (int i = 0; i < Loops; ++i)
      result = string.Concat(result, i.ToString());
    return result;
  }

  [Benchmark]
  public string StringBuilder()
  {
    StringBuilder sb = new StringBuilder(string.Empty);
    for (int i = 0; i < Loops; ++i)
      sb.Append(i.ToString());
    return sb.ToString();
  }
}
Note: In case it’s not obvious the [Params(..)] attribute lets you run the same benchmark for a set of different input values. In this case the Loops field is set to each of the values in turn, i.e. 1, 2, 3, 4, 5, 10, 15, 20, before another instance of the benchmark is run.
If you’ve been programming in C# for long enough, you’ll have no doubt have been given the guidance “use StringBuilder to concatenate strings”, but what is the actual difference?

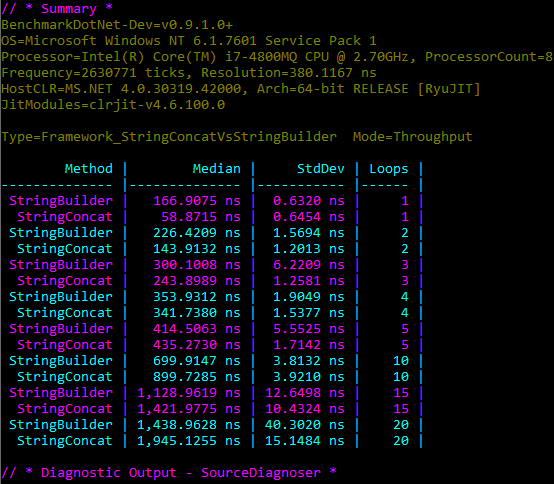
Well in terms of time taken there is a difference, but even with 20 loops it’s not huge, we are talking about roughly 500 ns, i.e. 0.0005 ms, so you would have to be doing it alot to notice a slow-down.
However, this time lets see what the results would look like if we have the BenchmarkDotNet “Garbage Collection” (GC) Diagnostics enabled:

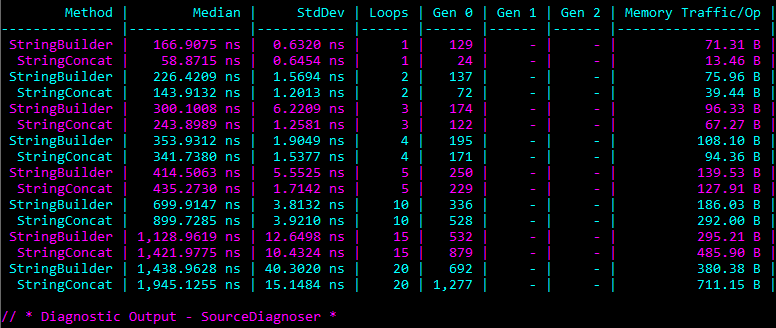
Here we can clearly see a difference between the benchmarks. Once we get beyond 10 loops, the StringBuilder benchmark is way more efficient compared to StringConcat. It causes way less “Generation 0” collections and allocates roughly 50% less bytes for each Operation, i.e. each invocation of the benchmark method.
It’s worth noting that in this case, 10 loops is the break-even point. Before that point StringConcat is marginally faster and allocates less memory, but after that point StringBuilder is more efficient. The reason is that there is a memory overhead for the StringBuilder class itself, which dominates the cost when you are only appending a few short strings (as we are in this particular benchmark). Interesting enough the .NET Runtime developers noticed this overhead and so introduced a StringBuilder Cache, to enable re-use of existing instances, rather than allocating a new one every time.
Dictionary vs IDictionary
But what about a less well-known example. Imagine after some re-factoring you noticed that your application was triggering a lot more Gen 0/1/2 collections (you do monitor this in your live systems right?) After looking at the recent code commits and carrying out some profiling you narrow the problem down to a refactoring that changed a variable declaration from Dictionary to IDictionary, i.e. exactly the type of refactoring that this Stack Overflow question is discussing.
To benchmark what’s actually going on here, we can write some code like so:
public class Framework_DictionaryVsIDictionary
{
  Dictionary<string, string> dict;
  IDictionary<string, string> idict;

  [Setup]
  public void Setup()
  {
    dict = new Dictionary<string, string>();
    idict = (IDictionary<string, string>)dict;
  }

  [Benchmark]
  public Dictionary<string, string> DictionaryEnumeration()
  {
    foreach (var item in dict)
    {
      ;
    }
    return dict;
  }

  [Benchmark]
  public IDictionary<string, string> IDictionaryEnumeration()
  {
    foreach (var item in idict)
    {
      ;
    }
    return idict;
  }
}
Note: we are deliberately not doing anything with the items inside the foreach loop because we just want to see what the difference in iteration of the 2 collections is. Also note that we are using the same underlying data structure, we are just accessing via an IDictionary cast in the 2nd benchmark.
So what results do we get:

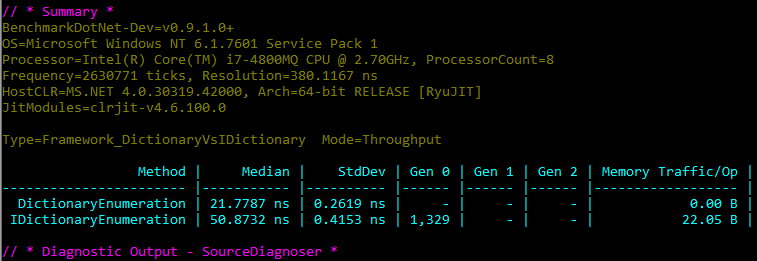
Nice and clear, accessing the same data via the IDictionary interface causes a lot of extra allocations, roughly 22 bytes per foreach loop. This in turn triggers a lot of extra GC collections. It’s worth pointing out that when BenchmarkDotNet executes, it will run the same benchmark method, IDictionaryEnumeration() in this case, millions of times, so that we can obtain an accurate measurment. Therefore the actual # of Gen 0 collections isn’t so important, it is the relative amount compared to the DictionaryEnumeration() benchmark that should be looked at.
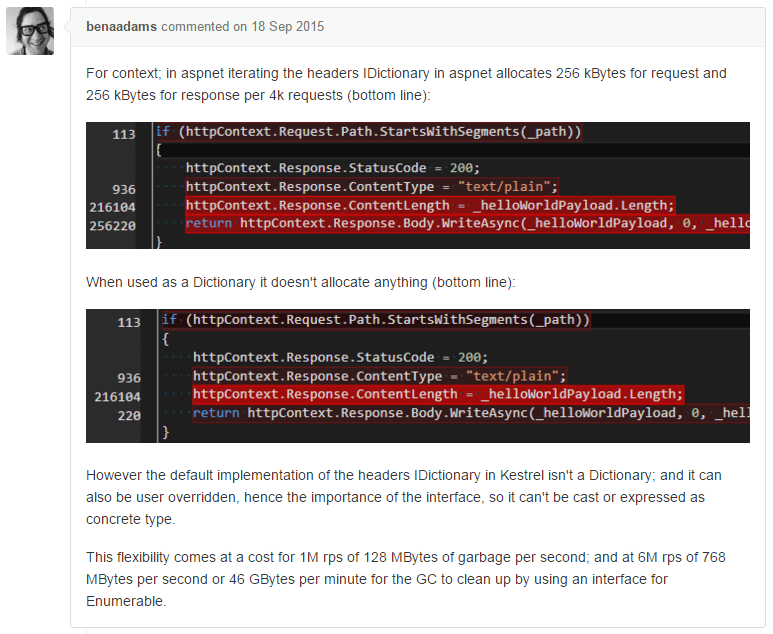
Now this scenario might seem a bit contrived and I have to admit that I knew the answer before I started investigating it, however it did originate from a real-life issue, discovered by Ben Adams. For the full background take a look at the CoreCLR GitHub issue, Avoid enumeration allocation via interface, but as shown below this was identified because in Kestrel/ASP.NET the request/resposne headers are kept in an IDictionary data structure and so cause an additional 128 MBytes of garbage per second, when running at 1 Million requests per/second.
Finally, what is the technical explanation of the additional allocations, quoting from Stephen Toub of Microsoft
… But when accessed via the interface, you’re using the interface method that’s typed to return
IEnumerator<KeyValuePair<TKey,TValue>>rather thanDictionary<TKey, TValue>.Enumerator, so the struct gets boxed.
and then further down the same issue
Yes, the issue isn’t just enumerator allocations, it’s also interface-based dispatch. In addition to boxing the enumerator, the
MoveNextandCurrentcalls made per element go from being potentially-inlineable non-virtual calls to being interface calls.
Implementation Details
Update Feb 2017 - This section is now out-of-date as the implementation details have now changed, please see Adam Sitnik’s blog post for all the details
This is all made possible be the excellent Gargage Collection ETW Events that the .NET runtime produces. In particular the GCAllocationTick_V2 Event that is fired each time approximately 100 KB is allocated. An xml representation of a typical event is shown below, you can see that 0x1A060 or 106,592 bytes have just been allocated.
<UserData>
  <GCAllocationTick_V3 xmlns='myNs'>
    <AllocationAmount>0x1A060</AllocationAmount>
    <AllocationKind>0</AllocationKind>
    <ClrInstanceID>34</ClrInstanceID>
    <AllocationAmount64>0x1A060</AllocationAmount64>
    <TypeID>0xEE05D18</TypeID>
    <TypeName>LibGit2Sharp.Core.GitDiffFile</TypeName>
    <HeapIndex>0</HeapIndex>
    <Address>0x32056CD0</Address>
  </GCAllocationTick_V3>
</UserData>
To collect these events BenchmarkDotNet uses the logman tool that is built into Windows. This runs in the background and collects the specified ETW events until you ask it to stop. These events are continuously written to an .etl file that can then be read by tools such as Windows Performance Analyzer. Once the ETW events have been collected, BenchmarkDotNet then parses them using the excellent TraceEvent library, using code like this:
using (var source = new ETWTraceEventSource(fileName))
{
  source.Clr.GCAllocationTick += (gcData =>
  {
    if (statsPerProcess.ContainsKey(gcData.ProcessID))
      statsPerProcess[gcData.ProcessID].AllocatedBytes += gcData.AllocationAmount64;
  });

  source.Clr.GCStart += (gcData =>
  {
    if (statsPerProcess.ContainsKey(gcData.ProcessID))
    {
      var genCounts = statsPerProcess[gcData.ProcessID].GenCounts;
      if (gcData.Depth >= 0 && gcData.Depth < genCounts.Length)
      {
        // ignore calls to GC.Collect(..) from BenchmarkDotNet itself
        if (gcData.Reason != GCReason.Induced)
          genCounts[gcData.Depth]++;
      }
    }
  });

  source.Process();
}
Hopefully this has shown you some of the power of BenchmarkDotNet, please consider giving it a go next time you need to (micro-)benchmark some .NET code, hopefully it will save you from having to hand-roll your own benchmarking code.
