Measuring the impact of the .NET Garbage Collector - An Update
23 Jun 2014 - 1047 wordstl;dr
Measuring performance accurately is hard. But it is a whole lot easier if someone with experience takes the time to explain your mistakes to you!!
This is an update to my previous post, if you haven’t read that, you might want to go back and read it first.
After I published that post, Gil Tene (@GilTene) the author of jHiccup, was kind enough to send me an email pointing out a few things I got wrong! It’s great that he took the time to do this and so (with his permission), I’m going to talk through his comments.
Firstly he pointed out that the premise for my investigation wasn’t in-line what jHiccup reports. So instead answering the question:
what % of pauses do what?
jHiccup answers a different question:
what % of my operations will see what minimum possible latency levels?
He also explained that I wasn’t measuring only GC pauses. This was something which I alluded to in my post, but didn’t explicitly point out.
...I suspect that your current data is somewhat contaminated by hiccups that are not GC pauses (normal blips of 2+ msec due to scheduling, etc.). Raising the 2 msec recording threshold (e.g. to 5 or 10msec) may help with that, but then you may miss some actual GC pauses in your report. There isn't really a good way around this, since "very short" GC pauses and "other system noise" overlap in magnitude.
So in summary, it is better to describe my tests as measuring any pauses in a program, not just GC pauses. Again quoting from Gil:
Over time (and based on experience), I think you may find that just using the jHiccup approach of "whatever is stopping my apps from running" will become natural, and that you'll stop analyzing the pure "what percent of GC pauses do what" question (if you think about it, the answer to that question is meaningless to applications).
This is so true, it really doesn’t matter what is slowing your app down or causing the user to experience unacceptable pauses. What matters is finding out if and how often this is happening and then doing something about it.
Tweaks made
He also suggested some tweaks to make to the code (emphasis mine):
- Record everything (good and bad): You current code only records pauses (measurements above 2msec). To report from a "% of operations" viewpoint, you need to record everything, unconditionally. As you probably see in jHiccup, what I record as hiccups is the measured time minus the expected sleep time. Recording everything will have the obvious effect of shifting the percentile levels to the right.
- Correct for coordinated omission. My "well trained" eye sees clear evidence of coordinated omission in your current charts (which is fine for "what % of pauses" question, but not for a "what % of operations" question): any vertical jumps in latency on a percentile chart are a strong indication of coordinated omission. While it is possible to have such jumps be "valid" and happening without coordinated omission in cases where the concurrently measured transactions are "either fast or slow, without blocking anything else" (e.g. a web page takes either 5msec or 250msec, and never any other number in between), these are very rare in the wild, and never happen in a jHiccup-like measurement. Then, whenever you see a 200 msec measurement, it also means that you "should have seen" measurements with the values 198, 196, 194, ... 4, but never got a chance to.
Based on these 2 suggestions, the code to record the timings becomes the following:
var timer = new Stopwatch();
var sleepTimeInMsecs = 1;
while (true)
{
  timer.Restart();
  Thread.Sleep(sleepTimeInMsecs);
  timer.Stop();

  // Record the pause (using the old method, for comparison)
  if (timer.ElapsedMilliseconds > 2)
    _oldhistogram.recordValue(timer.ElapsedMilliseconds);

  // more accurate method, correct for coordinated omission
  _histogram.recordValueWithExpectedInterval(
        timer.ElapsedMilliseconds - sleepTimeInMsecs, 1);
}
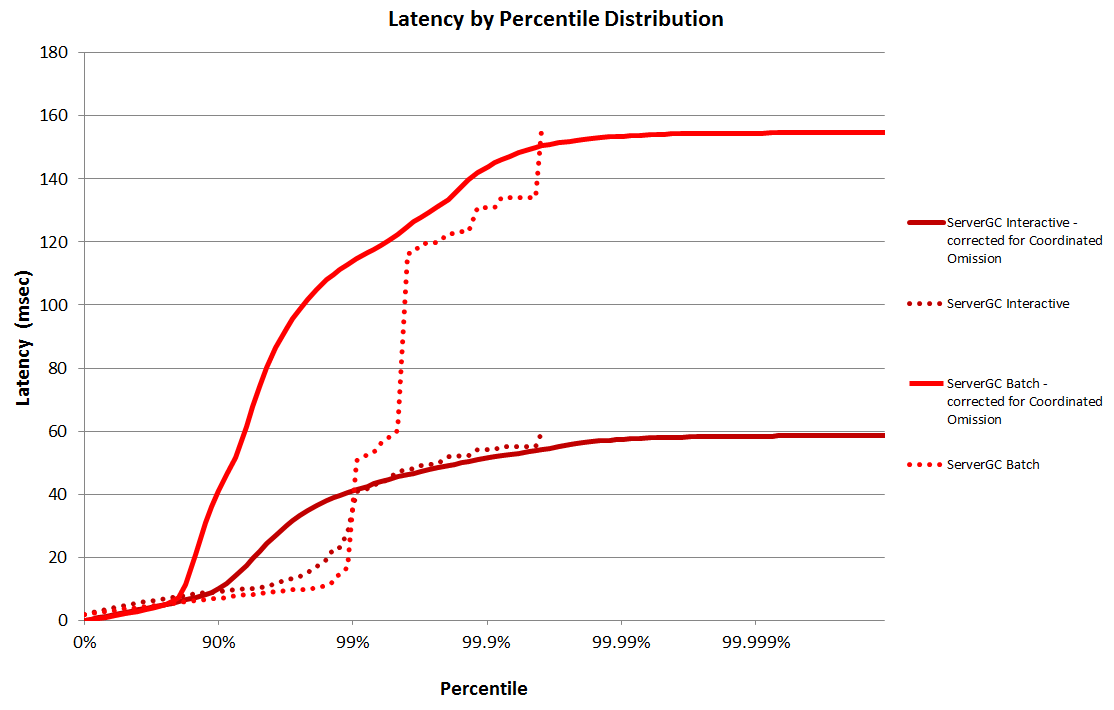
To see what difference this made to the graphs I re-ran the test, this time just in Server GC mode. You can see the changes on the graph below, the dotted lines are the original (inaccurate) mode and the solid lines show the results after they have been corrected for coordinated omission.
Correcting for Coordinated Omission
This is an interesting subject and after becoming aware of it, I’ve spent some time reading up on it and trying to understand it more deeply. One way to comprehend it, is to take a look at the code in HdrHistogram that handles it:
recordCountAtValue(count, value);
if (expectedIntervalBetweenValueSamples <= 0)
    return;

for (long missingValue = value - expectedIntervalBetweenValueSamples;
     missingValue >= expectedIntervalBetweenValueSamples;
     missingValue -= expectedIntervalBetweenValueSamples)
{
    recordCountAtValue(count, missingValue);
}
As you can see it fills in all the missing values, from 0 to the value you are actually storing.
It is comforting to know that I’m not alone in making this mistake, the authors of Disruptor and log4j2 both made the same mistake when measuring percentiles in their high-performance code.
Finally if you want some more information on Coordinated Omission and the issue it is trying to prevent, take a look at this post from the Java Advent calendar (you need to scroll down past the calendar to see the actual post). The main point is that without correcting for it, you will be getting inaccurate percentile values, which kind-of defeats the point of making accurate performance measurements in the first place!