Roslyn code base - performance lessons (part 1)
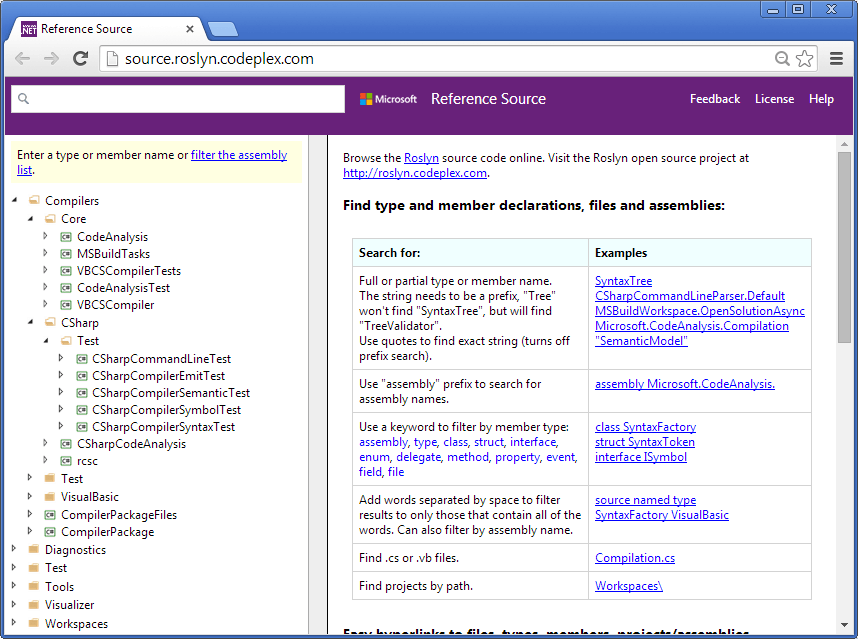
05 Jun 2014 - 610 wordsAt Build 2014 Microsoft open source their next-generation C#/VB.NET compiler, called Roslyn. The project is hosted on codeplex and you can even browse the source, using the new Reference Source browser, which is itself powered by Roslyn (that’s some crazy, meta-recursion going on there!).
Easter Eggs
There’s also some nice info available, for instance you can get a summary of the number of lines of code, files etc, you can also list the projects and assemblies.
ProjectCount=50
DocumentCount=4,366
LinesOfCode=2,355,329
BytesOfCode=96,850,461
DeclaredSymbols=124,312
DeclaredTypes=6,649
PublicTypes=2,076
That’s ~2.3 million lines of code, across over 4300 files! (HT to Slaks for pointing out this functionality)
Being part of the process
If you are in any way interested in new C# language features or just want to find out how a compiler is built, this is really great news. On top of this, not only have Microsoft open sourced the code, the entire process is there for everyone to see. You can get a peek behind the scenes of the C# Design Meetings, debate possible new features with some of the designers and best of all, they seem genuinely interested in getting community feedback.
Taking performance seriously
But what I find really interesting is the performance lessons that can be learned. As outlined in this post, performance is something they take seriously. It’s not really surprising, the new compiler can’t afford to be slower than the old C++ one and developers are pretty demanding customers, so any performance issues would be noticed and complained about.
To give you an idea of what’s involved, here’s the list of scenarios that they measure the performance against.
- Build timing of small, medium, and (very) large solutions
- Typing speed when working in the above solutions, including “goldilocks” tests where we slow the typing entry to the speed of a human being
- IDE feature speed (navigation, rename, formatting, pasting, find all references, etc…)
- Peak memory usage for the above solutions
- All of the above for multiple configurations of CPU cores and available memory
And to make sure that they have accurate measurements and that they know as soon as performance has degraded (emphasis mine):
These are all assessed & reported daily, so that we can identify & repair any check-in that introduced a regression as soon as possible, before it becomes entrenched. Additionally, we don’t just check for the average time elapsed on a given metric; we also assess the 98th & 99.9th percentiles, because we want good performance all of the time, not just some of the time.
There’s lots of information about why just using averages is a bad idea, particularly when dealing with response times, so it’s good to see that they are using percentiles as well. But running performance tests as part of their daily builds and tracking those numbers over time, is a really good example of taking performance seriously, performance testing wasn’t left till the end, as an after-thought.
I’ve worked on projects where the performance targets were at best vague and ensuring they were met was left till right at the end, after all the features had been implemented. It’s much harder to introduce performance testing at this time, we certainly don’t do it with unit testing, so why with performance testing?
This ties in with Stack Overflow mantra:
Performance is a feature
Next time I’ll be looking at specific examples of performance enhancements made in the code base and what problems they are trying to solve.