Stack Overflow - performance lessons (part 2)
05 Sep 2014 - 1188 wordsIn Part 1 I looked at some of the more general performance issues that can be learnt from Stack Overflow (the team/product), in Part 2 I’m looking at some of the examples of coding performance lessons.
Please don’t take these blog posts as blanket recommendations of techniques that you should go away and apply to your code base. They are specific optimisations that you can use if you want to squeeze every last drop of performance out of your CPU.
Also, don’t optimise anything unless you have measured and profiled first, you will probably optimise the wrong thing!
Battles with the .NET Garbage Collector
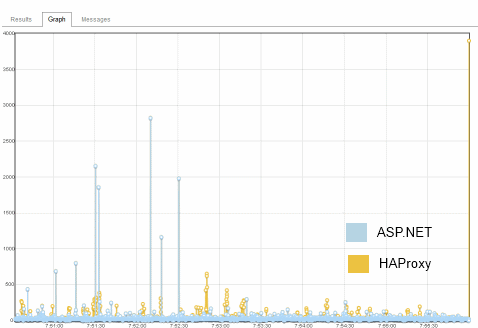
I first learnt about the performance work done in Stack Overflow (the site/company), when I read the post on their battles with the .NET Garbage Collector (GC). If you haven’t read it, the short summary is that they were experiencing page load times that would suddenly spike to the 100’s of msecs, compared to the normal sub 10 msecs they were use to. After investigating for a few days they narrowed the problem down to the behaviour of the GC. GC pauses are a real issue and even the new modes available in .NET 4.5 don’t fully eliminate them, see my previous investigation for more information.
One thing to remember is that to make this all happen, they needed the following items in place:
- Monitoring in production - these issues would only show up under load, once the application had been running for a while, so they would be very hard to recreate in staging or during development.
- Multiple measurements - they recorded both ASP.NET and IIS web server response times and were able to cross-reference them (see image below).
- Storing outliers - these spikes rarely happened so having detailed metrics was needed, averages hide too much information.
- Good knowledge of the .NET GC - according to the article, it took them 3 weeks to identify and fix this issue “So Marc and I set off on a 3 week adventure to resolve the memory pressure.”
You can read all the gory details of the fix and the follow-up in the posts below, but the tl;dr is that they removed of all the work that the .NET Garbage Collector had to do, thus eliminating the pauses:
- In managed code we trust, our recent battles with the .NET Garbage Collector
- Assault by GC
- Technical Debt, a case study : tags (a follow-up post)
Jil - A fast JSON (de)serializer, with a number of somewhat crazy optimization tricks.
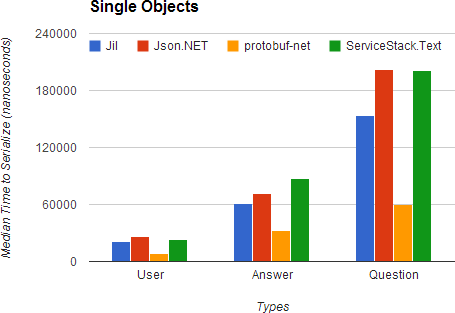
But if you think that the struct based code they wrote is crazy, their JSON serialisation library, Jil, takes things to a new level. This is all in the pursuit of the maximum performance and based on their benchmarks, it seems to be working!
Note: protobuf-net is a binary serialisation library, but doesn’t support JSON, it’s only included is a base-line:
For instance, instead of writing code like this
public T Serialise<T>(string json, bool isJSONP)
{
  if (isJSONP)
  {
    // code to handle JSONP
  }
  else
  {
    // code to handle regular JSON
  }
}
They write code like this, which is a classic memory/speed trade-off.
public ISerialiser GetSerialiser(bool isJSONP)
{
  if (isJSONP)
    return new SerialiseWithJSONP();
  else
    return new Serialiser();
}

public class SerialiserWithJSONP : ISerialiser
{
  private T Serialiser<T>(string json)
  {
    // code to handle JSONP
  }
}

public class Serialiser : ISerialiser
{
  private T Serialise<T>(string json)
  {
    // code to handle regular JSON
  }
}
This means that during serialisation there doesn’t need to be any “feature switches”, they just emit the different versions of the code at creation time and based on the options you specify, hand you the correct one. Of course the classes (SerialiserWithJSONP and Serialiser in this case) are dynamically created just once and then cached for later re-use, so the cost of the dymanic code generation is only paid once.
By doing this the code plays nicely with CPU branch prediction, because it has a nice predictable pattern that the CPU can easily work with. It also has the added benefit of making the methods smaller, which may make then candidates for in-lining by the the .NET JITter.
For more examples of optimisations used, see the links below
Jil - Marginal Gains.
On top of this the measure everything to ensure that the optimisations actually work! These tests are all run as unit-tests, allowing easy generation of the results, take a look at ReorderMembers for instance.
Note: All the times are in milliseconds, but timed over 1000’s of runs, not per call.
| Feature name | Original | Improved | Difference |
|---|---|---|---|
| ReorderMembers | 2721 | 2712 | 9 |
| SkipNumberFormatting | 166 | 163 | 3 |
| UseCustomIntegerToString | 589 | 339 | 250 |
| SkipDateTimeMathMethods | 108 | 100 | 8 |
| UseCustomISODateFormatting | 399 | 269 | 130 |
| UseFastLists | 277 | 267 | 10 |
| UseFastArrays | 486 | 469 | 17 |
| UseFastGuids | 744 | 304 | 440 |
| AllocationlessDictionaries | 134 | 127 | 7 |
| PropagateConstants | 77 | 35 | 42 |
| AlwaysUseCharBufferForStrings | 63 | 56 | 7 |
| UseHashWhenMatchingMembers | 141 | 131 | 10 |
| DynamicDeserializer_UseFastNumberParsing | 94 | 51 | 43 |
| DynamicDeserializer_UseFastIntegerConversion | 131 | 131 | 2 |
| UseHashWhenMatchingEnums | 38 | 10 | 28 |
| UseCustomWriteIntUnrolledSigned | 2182 | 1765 | 417 |
This is very similar to the “Marginal Gains” approach that worked so well for British Cycling in the last Olympics:
There’s fitness and conditioning, of course, but there are other things that might seem on the periphery, like sleeping in the right position, having the same pillow when you are away and training in different places. Do you really know how to clean your hands? Without leaving the bits between your fingers? If you do things like that properly, you will get ill a little bit less. “They’re tiny things but if you clump them together it makes a big difference.”
Summary
All-in-all there is a lot to be learnt from code and blog posts that have come from Stack Overflow developers, I’m glad they’ve shared everything so openly. Also by having a high-profile website running on .NET, it stops the argument that .NET is inherently slow.