Tools for Exploring .NET Internals
15 Jun 2018 - 1954 wordsWhether you want to look at what your code is doing ‘under-the-hood’ or you’re trying to see what the ‘internals’ of the CLR look like, there is a whole range of tools that can help you out.
To give ‘credit where credit is due’, this post is based on a tweet, so thanks to everyone who contributed to the list and if I’ve missed out any tools, please let me know in the comments below.
While you’re here, I’ve also written other posts that look at the ‘internals’ of the .NET Runtime:
- Exploring the Internals of the .NET Runtime (a ‘how-to’ guide)
- Resources for Learning about .NET Internals (other blogs that cover ‘internals’)
Honourable Mentions
Firstly I’ll start by mentioning that Visual Studio has a great debugger and so does VSCode. Also there are lots of very good (commercial) .NET Profilers and Application Monitoring Tools available that you should also take a look at. For example I’ve recently been playing around with Codetrack and I’m very impressed by what it can do!
However, the rest of the post is going to look at some more single-use tools that give a even deeper insight into what is going on. As a added bonus they’re all ‘open-source’, so you can take a look at the code and see how they work!!
PerfView by Vance Morrison
PerfView is simply an excellent tool and is the one that I’ve used most over the years. It uses ‘Event Tracing for Windows’ (ETW) Events to provide a deep insight into what the CLR is doing, as well as allowing you to profile Memory and CPU usage. It does have a fairly steep learning curve, but there are some nice tutorials to help you along the way and it’s absolutely worth the time and effort.
Also, if you need more proof of how useful it is, Microsoft Engineers themselves use it and many of the recent performance improvements in MSBuild were carried out after using PerfView to find the bottlenecks.
PerfView is built on-top of the Microsoft.Diagnostics.Tracing.TraceEvent library which you can use in your own tools. In addition, since it’s been open-sourced the community has contributed and it has gained some really nice features, including flame-graphs:
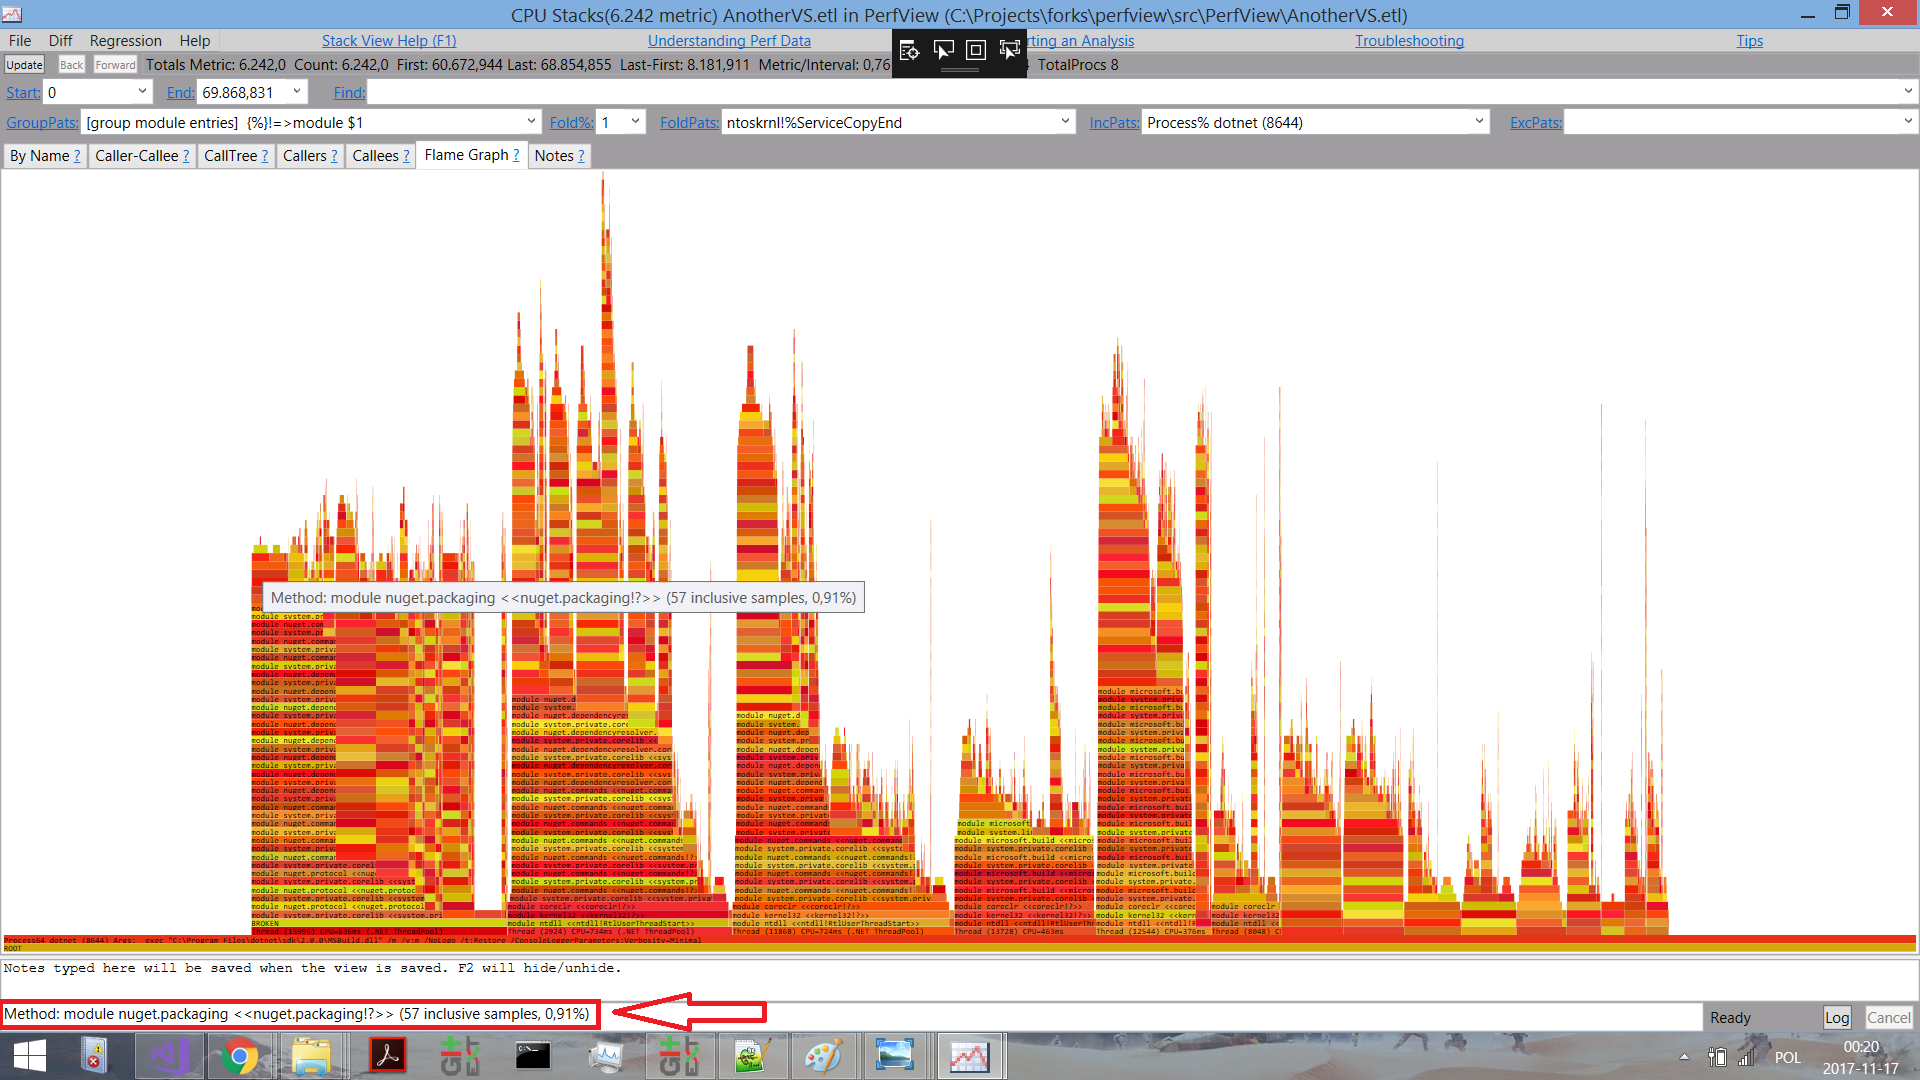
(Click for larger version)
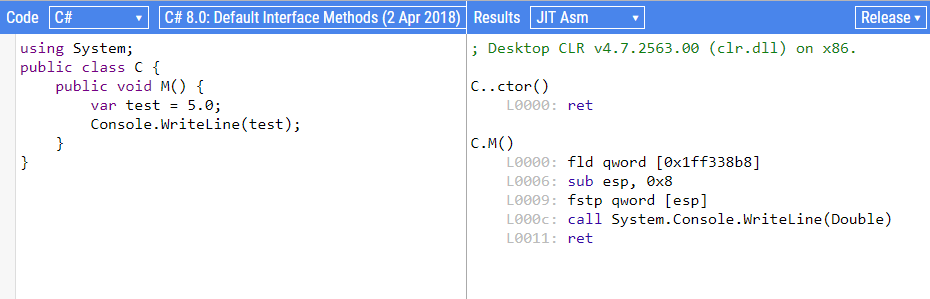
SharpLab by Andrey Shchekin
SharpLab started out as a tool for inspecting the IL code emitted by the Roslyn compiler, but has now grown into much more:
SharpLab is a .NET code playground that shows intermediate steps and results of code compilation. Some language features are thin wrappers on top of other features – e.g.
using()becomestry/catch. SharpLab allows you to see the code as compiler sees it, and get a better understanding of .NET languages.
If supports C#, Visual Basic and F#, but most impressive are the ‘Decompilation/Disassembly’ features:
There are currently four targets for decompilation/disassembly:
- C#
- Visual Basic
- IL
- JIT Asm (Native Asm Code)
That’s right, it will output the assembly code that the .NET JIT generates from your C#:
Object Layout Inspector by Sergey Teplyakov
This tool gives you an insight into the memory layout of your .NET objects, i.e. it will show you how the JITter has decided to arrange the fields within your class or struct. This can be useful when writing high-performance code and it’s helpful to have a tool that does it for us because doing it manually is tricky:
There is no official documentation about fields layout because the CLR authors reserved the right to change it in the future. But knowledge about the layout can be helpful if you’re curious or if you’re working on a performance critical application.
How can we inspect the layout? We can look at a raw memory in Visual Studio or use
!dumpobjcommand in SOS Debugging Extension. These approaches are tedious and boring, so we’ll try to write a tool that will print an object layout at runtime.
From the example in the GitHub repo, if you use TypeLayout.Print<NotAlignedStruct>() with code like this:
public struct NotAlignedStruct
{
    public byte m_byte1;
    public int m_int;

    public byte m_byte2;
    public short m_short;
}
You’ll get the following output, showing exactly how the CLR will layout the struct in memory, based on it’s padding and optimization rules.
Size: 12. Paddings: 4 (%33 of empty space)
|================================|
|     0: Byte m_byte1 (1 byte)   |
|--------------------------------|
|   1-3: padding (3 bytes)       |
|--------------------------------|
|   4-7: Int32 m_int (4 bytes)   |
|--------------------------------|
|     8: Byte m_byte2 (1 byte)   |
|--------------------------------|
|     9: padding (1 byte)        |
|--------------------------------|
| 10-11: Int16 m_short (2 bytes) |
|================================|
The Ultimate .NET Experiment (TUNE) by Konrad Kokosa
TUNE is a really intriguing tool, as it says on the GitHub page, it’s purpose is to help you
… learn .NET internals and performance tuning by experiments with C# code.
You can find out more information about what it does in this blog post, but at a high-level it works like this:
- write a sample, valid C# script which contains at least one class with public method taking a single string parameter. It will be executed by hitting Run button. This script can contain as many additional methods and classes as you wish. Just remember that first public method from the first public class will be executed (with single parameter taken from the input box below the script). …
- after clicking Run button, the script will be compiled and executed. Additionally, it will be decompiled both to IL (Intermediate Language) and assembly code in the corresponding tabs.
- all the time Tune is running (including time during script execution) a graph with GC data is being drawn. It shows information about generation sizes and GC occurrences (illustrated as vertical lines with the number below indicating which generation has been triggered).
And looks like this:
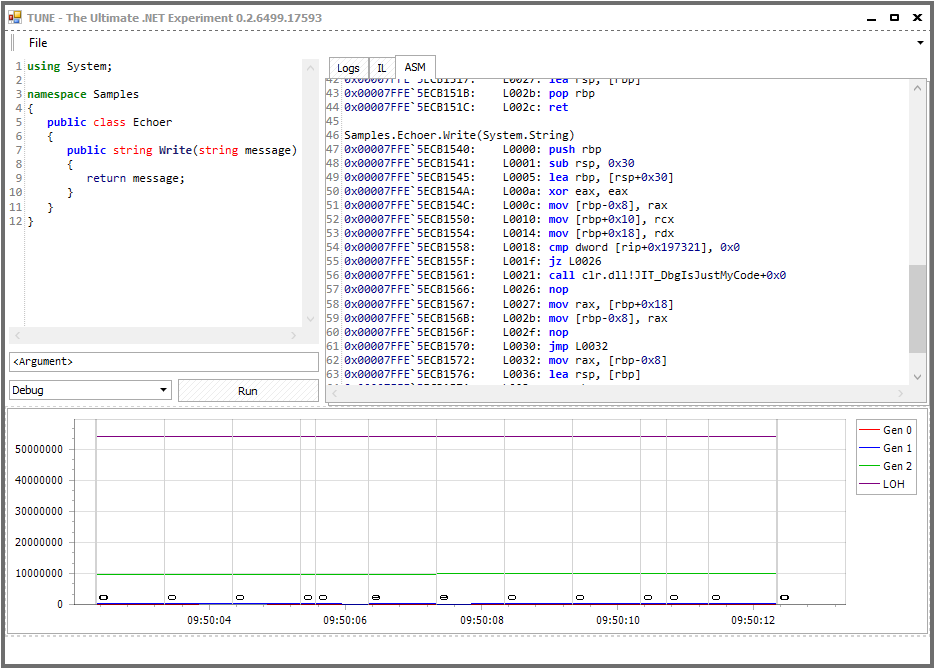
(Click for larger version)
Tools based on CLR Memory Diagnostics (ClrMD)
Finally, we’re going to look at a particular category of tools. Since .NET came out you’ve always been able to use WinDBG and the SOS Debugging Extension to get deep into the .NET runtime. However it’s not always the easiest tool to get started with and as this tweet says, it’s not always the most productive way to do things:
Besides how complex it is, the idea is to build better abstractions. Raw debugging at the low level is just usually too unproductive. That to me is the promise of ClrMD, that it lets us build specific extensions to extract quickly the right info
— Tomas Restrepo (@tomasrestrepo) March 14, 2018
Fortunately Microsoft made the ClrMD library available (a.k.a Microsoft.Diagnostics.Runtime), so now anyone can write a tool that analyses memory dumps of .NET programs. You can find out even more info in the official blog post and I also recommend taking a look at ClrMD.Extensions that “.. provide integration with LINPad and to make ClrMD even more easy to use”.
I wanted to pull together a list of all the existing tools, so I enlisted twitter to help. Note to self: careful what you tweet, the WinDBG Product Manager might read your tweets and get a bit upset!!
Well this just hurts my feelings :(
— Andy Luhrs (@aluhrs13) March 14, 2018
Most of these tools are based on ClrMD because it’s the easiest way to do things, however you can use the underlying COM interfaces directly if you want. Also, it’s worth pointing out that any tool based on ClrMD is not cross-platform, because ClrMD itself is Windows-only. For cross-platform options see Analyzing a .NET Core Core Dump on Linux
Finally, in the interest of balance, there have been lots of recent improvements to WinDBG and because it’s extensible there have been various efforts to add functionality to it:
- Extending the new WinDbg, Part 1 – Buttons and commands
- Extending the new WinDbg, Part 2 – Tool windows and command output
- Extending the new WinDbg, Part 3 – Embedding a C# interpreter
- WinDBG extension + UI tool extensions and here
- NetExt a WinDBG application that makes .NET debugging much easier as compared to the current options: sos or psscor, also see this InfoQ article
Having said all that, onto the list:
- SuperDump (GitHub)
- A service for automated crash-dump analysis (presentation)
- msos (GitHub)
- Command-line environment a-la WinDbg for executing SOS commands without having SOS available.
- MemoScope.Net (GitHub)
- A tool to analyze .Net process memory Can dump an application’s memory in a file and read it later.
- The dump file contains all data (objects) and threads (state, stack, call stack). MemoScope.Net will analyze the data and help you to find memory leaks and deadlocks
- dnSpy (GitHub)
- .NET debugger and assembly editor
- You can use it to edit and debug assemblies even if you don’t have any source code available!!
- MemAnalyzer (GitHub)
- A command line memory analysis tool for managed code.
- Can show which objects use most space on the managed heap just like
!DumpHeapfrom Windbg without the need to install and attach a debugger.
- DumpMiner (GitHub)
- UI tool for playing with ClrMD, with more features coming soon
- Trace CLI (GitHub)
- A production debugging and tracing tool
- Shed (GitHub)
- Shed is an application that allow to inspect the .NET runtime of a program in order to extract useful information. It can be used to inspect malicious applications in order to have a first general overview of which information are stored once that the malware is executed. Shed is able to:
- Extract all objects stored in the managed heap
- Print strings stored in memory
- Save the snapshot of the heap in a JSON format for post-processing
- Dump all modules that are loaded in memory
- Shed is an application that allow to inspect the .NET runtime of a program in order to extract useful information. It can be used to inspect malicious applications in order to have a first general overview of which information are stored once that the malware is executed. Shed is able to:
You can also find many other tools that make use of ClrMD, it was a very good move by Microsoft to make it available.
Other Tools
A few other tools that are also worth mentioning:
- DebugDiag
- The DebugDiag tool is designed to assist in troubleshooting issues such as hangs, slow performance, memory leaks or memory fragmentation, and crashes in any user-mode process (now with ‘CLRMD Integration’)
- SOSEX (might not be developed any more)
- … a debugging extension for managed code that begins to alleviate some of my frustrations with SOS
- VMMap from Sysinternals
- VMMap is a process virtual and physical memory analysis utility.
- I’ve previously used it to look at Memory Usage Inside the CLR
Discuss this post on Hacker News or /r/programming