A Hitchhikers Guide to the CoreCLR Source Code
23 Mar 2017 - 5109 words
photo by Alan O’Rourke
Just over 2 years ago Microsoft open-sourced the entire .NET framework, this posts attempts to provide a ‘Hitchhikers Guide’ to the source-code found in the CoreCLR GitHub repository.
To make it easier for you to get to the information you’re interested in, this post is split into several parts
It’s worth pointing out that .NET Developers have provided 2 excellent glossaries, the CoreCLR one and the CoreFX one, so if you come across any unfamiliar terms or abbreviations, check these first. Also there is extensive documentation available and if you are interested in the low-level details I really recommend checking out the ‘Book of the Runtime’ (BotR).
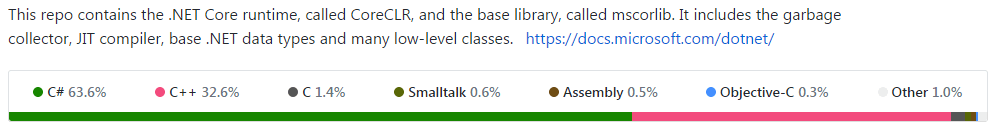
Overall Stats
If you take a look at the repository on GitHub, it shows the following stats for the entire repo
But most of the C# code is test code, so if we just look under /src (i.e. ignore any code under /tests) there are the following mix of Source file types, i.e. no ‘.txt’, ‘.dat’, etc:
  - 2,012 .cpp
  - 1,183 .h
  - 956 .cs
  - 113 .inl
  - 98 .hpp
  - 51 .S
  - 43 .py
  - 42 .asm
  - 24 .idl
  - 20 .c
So by far the majority of the code is written in C++, but there is still also a fair amount of C# code (all under ‘mscorlib’). Clearly there are low-level parts of the CLR that have to be written in C++ or Assembly code because they need to be ‘close to the metal’ or have high performance, but it’s interesting that there are large parts of the runtime written in managed code itself.
Note: All stats/lists in the post were calculated using commit 51a6b5c from the 9th March 2017.
Compared to ‘Rotor’
As a comparison here’s what the stats for ‘Rotor’ the Shared Source CLI looked like back in October 2002. Rotor was ‘Shared Source’, not truly ‘Open Source’, so it didn’t have the same community involvements as the CoreCLR.
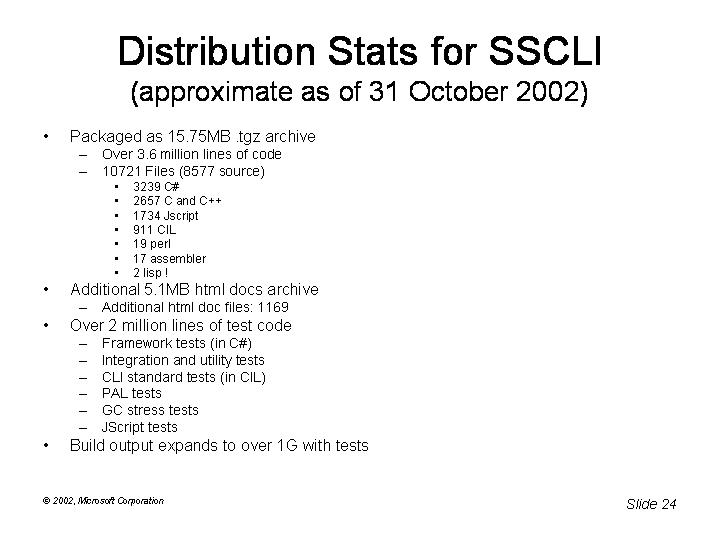
Note: SSCLI aka ‘Rotor’ includes the fx or base class libraries (BCL), but the CoreCLR doesn’t as they are now hosted separately in the CoreFX GitHub repository
For reference, the equivalent stats for the CoreCLR source in March 2017 look like this:
- Packaged as 61.2 MB .zip archive
- Over 10.8 million lines of code (2.6 million of source code, under \src)
- 24,485 Files (7,466 source)
- 6,626 C# (956 source)
- 2,074 C and C++
- 3,701 IL
- 93 Assembler
- 43 Python
- 6 Perl
- Over 8.2 million lines of test code
- Build output expands to over 1.2 G with tests
- Product binaries 342 MB
- Test binaries 909 MB
Top 10 lists
These lists are mostly just for fun, but they do give some insights into the code-base and how it’s structured.
Top 10 Largest Files
You might have heard about the mammoth source file that is gc.cpp, which is so large that GitHub refuses to display it.
But it turns out it’s not the only large file in the source, there are also several files in the JIT that are around 20K LOC. However it seems that all the large files are C++ source code, so if you’re only interested in C# code, you don’t have to worry!!
| File | # Lines of Code | Type | Location |
|---|---|---|---|
| gc.cpp | 37,037 | .cpp | \src\gc\ |
| flowgraph.cpp | 24,875 | .cpp | \src\jit\ |
| codegenlegacy.cpp | 21,727 | .cpp | \src\jit\ |
| importer.cpp | 18,680 | .cpp | \src\jit\ |
| morph.cpp | 18,381 | .cpp | \src\jit\ |
| isolationpriv.h | 18,263 | .h | \src\inc\ |
| cordebug.h | 18,111 | .h | \src\pal\prebuilt\inc\ |
| gentree.cpp | 17,177 | .cpp | \src\jit\ |
| debugger.cpp | 16,975 | .cpp | \src\debug\ee\ |
Top 10 Longest Methods
The large methods aren’t actually that hard to find, because they’re all have #pragma warning(disable:21000) before them, to keep the compiler happy! There are ~40 large methods in total, here’s the ‘Top 10’
Top 10 files with the Most Commits
Finally, lets look at which files have been changed the most since the initial commit on GitHub back in January 2015 (ignore ‘merge’ commits)
| File | # Commits |
|---|---|
| src\jit\morph.cpp | 237 |
| src\jit\compiler.h | 231 |
| src\jit\importer.cpp | 196 |
| src\jit\codegenxarch.cpp | 190 |
| src\jit\flowgraph.cpp | 171 |
| src\jit\compiler.cpp | 161 |
| src\jit\gentree.cpp | 157 |
| src\jit\lower.cpp | 147 |
| src\jit\gentree.h | 137 |
| src\pal\inc\pal.h | 136 |
High-level Overview
Next we’ll take a look at how the source code is structured and what are the main components.
They say “A picture is worth a thousand words”, so below is a treemap with the source code files grouped by colour into the top-level sections they fall under. You can hover over an individual box to get more detailed information and can click on the different radio buttons to toggle the sizing (LOC/Files/Commits)
Notes and Observations
- The ‘# Commits’ only represent the commits made on GitHub, in the 2 1/2 years since the CoreCLR was open-sourced. So they are skewed to the recent work and don’t represent changes made over the entire history of the CLR. However it’s interesting to see which components have had more ‘churn’ in the last few years (i.e ‘jit’) and which have been left alone (e.g. ‘pal’)
- From the number of LOC/files it’s clear to see what the significant components are within the CoreCLR source, e.g ‘vm’, ‘jit’, ‘pal’ & ‘mscorlib’ (these are covered in detail in the next part of this post)
- In the ‘VM’ section it’s interesting to see how much code is generic ~650K LOC and how much is per-CPU architecture 25K LOC for ‘i386’, 16K for ‘amd64’, 14K for ‘arm’ and 7K for ‘arm64’. This suggests that the code is nicely organised so that the per-architecture work is minimised and cleanly separated out.
- It’s surprising (to me) that the ‘GC’ section is as small as it is, I always thought of the GC is a very complex component, but there is way more code in the ‘debugger’ and the ‘pal’.
- Likewise, I never really appreciated the complexity if the ‘JIT’, it’s the 2nd largest component, comprising over 370K LOC.
If you’re interested, this raw numbers for the code under ‘/src’ are available in this gist and for the code under ‘/tests/src’ in this gist.
Deep Dive into Individual Areas
As the source code is well organised, the top-level folders (under /src) correspond to the logical components within the CoreCLR. We’ll start off by looking at the most significant components, i.e. the ‘Debugger’, ‘Garbage Collector’ (GC), ‘Just-in-Time compiler’ (JIT), ‘mscorlib’ (all the C# code), ‘Platform Adaptation Layer’ (PAL) and the CLR ‘Virtual Machine’ (VM).
mscorlib
The ‘mscorlib’ folder contains all the C# code within the CoreCLR, so it’s the place that most C# developers would start looking if they wanted to contribute. For this reason it deserves it’s own treemap, so we can see how it’s structured:
So by-far the bulk of the code is at the ‘top-level’, i.e. directly in the ‘System’ namespace, this contains the fundamental types that have to exist for the CLR to run, such as:
AppDomain,WeakReference,Type,Array,Delegate,Object,StringBoolean,Byte,Char,Int16,Int32, etcTuple,Span,ArraySegment,Attribute,DateTime
Where possible the CoreCLR is written in C#, because of the benefits that ‘managed code’ brings, so there is a significant amount of code within the ‘mscorlib’ section. Note that anything under here is not externally exposed, when you write C# code that runs against the CoreCLR, you actually access everything through the CoreFX, which then type-forwards to the CoreCLR where appropriate.
I don’t know the rules for what lives in CoreCLR v CoreFX, but based on what I’ve read on various GitHub issues, it seems that over time, more and more code is moving from CoreCLR -> CoreFX.
However the managed C# code is often deeply entwined with unmanaged C++, for instance several types are implemented across multiple files, e.g.
- Arrays - Arrays.cs, array.cpp, array.h
- Assemblies - Assembly.cs, assembly.cpp, assembly.hpp
From what I understand this is done for performance reasons, any code that is perf sensitive will end up being implemented in C++ (or even Assembly), unless the JIT can suitable optimise the C# code.
Code shared with CoreRT
Recently there has been a significant amount of work done to moved more and more code over into the ‘shared partition’. This is the area of the CoreCLR source code that is shared with CoreRT (‘the .NET Core runtime optimized for AOT compilation’). Because certain classes are implemented in both runtimes, they’ve ensured that the work isn’t duplicated and any fixes are shared in both locations. You can see how this works by looking at the links below:
- CoreCLR
- CoreRT
Other parts of mscorlib
All the other sections of mscorlib line up with namespaces available in the .NET runtime and contain functionality that most C# devs will have used at one time or another. The largest ones in there are shown below (click to go directly to the source code):
- System.Reflection and System.Reflection.Emit
FieldInfo,PropertyInfo,MethodInfo,AssemblyBuilder,TypeBuilder,MethodBuilder,ILGenerator
- System.Globalization
CultureInfo,CalendarInfo,DateTimeParse,JulianCalendar,HebrewCalendar
- System.Threading and System.Threading.Tasks
Thread,Timer,Semaphore,Mutex,AsyncLocal<T>,Task,Task<T>,CancellationToken
- System.Runtime.CompilerServices and System.Runtime.InteropServices
Unsafe,[CallerFilePath],[CallerLineNumber],[CallerMemberName],GCHandle,[LayoutKind],[MarshalAs(..)],[StructLayout(LayoutKind ..)]
- System.Diagnostics
Assert,Debugger,Stacktrace
- System.Text
StringBuilder,ASCIIEncoding,UTF8Encoding,UnicodeEncoding
- System.Collections
ArrayList,Hashtable
- System.Collections.Generic
Dictionary<T,U>,List<T>
- System.IO
Stream,MemoryStream,File,TestReader,TestWriter
vm (Virtual Machine)
The VM, not surprisingly, is the largest component of the CoreCLR, with over 640K L.O.C spread across 576 files, and it contains the guts of the runtime. The bulk of the code is OS and CPU independent and written in C++, however there is also a significant amount of architecture-specific assembly code, see the section ‘CPU Architecture-specific code’ for more info.
The VM contains the main start-up routine of the entire runtime EEStartupHelper() in ceemain.cpp, see ‘The 68 things the CLR does before executing a single line of your code’ for all the details. In addition it provides the following functionality:
- Type System
- Loading types/classes
- Threading
- Exception Handling and Stack Walking
- Fundamental Types
- Generics
- An entire Interpreter (yes .NET can run interpreted!!)
- Function calling mechanisms (see BotR for more info)
- Stubs (used for virtual dispatch and delegates amongst other things)
- Event Tracing
- Profiler
- P/Invoke
- Reflection
CPU Architecture-specific code
All the architecture-specific code is kept separately in several sub-folders, amd64, arm, arm64 and i386. For example here’s the various implementations of the WriteBarrier function used by the GC:
- amd64 (.asm), there is also a .S version
- arm
- arm64
- i386
jit (Just-in-Time compiler)
Before we look at the actual source code, it’s worth looking at the different ‘flavours’ or the JIT that are available:
Fortunately one of the Microsoft developers has clarified which one should be used
Here’s my guidance on how non-MS contributors should think about contributing to the JIT: If you want to help advance the state of the production code-generators for .NET, then contribute to the new RyuJIT x86/ARM32 backend. This is our long term direction. If instead your interest is around getting the .NET Core runtime working on x86 or ARM32 platforms to do other things, by all means use and contribute bug fixes if necessary to the LEGACY_BACKEND paths in the RyuJIT code base today to unblock yourself. We do run testing on these paths today in our internal testing infrastructure and will do our best to avoid regressing it until we can replace it with something better. We just want to make sure that there will be no surprises or hard feelings for when the time comes to remove them from the code-base.
JIT Phases
The JIT has almost 90 source files, but fortunately they correspond to the different phases it goes through, so it’s not too hard to find your way around. Using the table from ‘Phases of RyuyJIT’, I added the right-hand column so you can jump to the relevant source file(s):
| Phase | IR Transformations | File |
|---|---|---|
| Pre-import | Compiler->lvaTable created and filled in for each user argument and variable. BasicBlock list initialized. |
compiler.hpp |
| Importation | GenTree nodes created and linked in to Statements, and Statements into BasicBlocks. Inlining candidates identified. |
importer.cpp |
| Inlining | The IR for inlined methods is incorporated into the flowgraph. | inline.cpp and inlinepolicy.cpp |
| Struct Promotion | New lvlVars are created for each field of a promoted struct. | morph.cpp |
| Mark Address-Exposed Locals | lvlVars with references occurring in an address-taken context are marked. This must be kept up-to-date. | compiler.hpp |
| Morph Blocks | Performs localized transformations, including mandatory normalization as well as simple optimizations. | morph.cpp |
| Eliminate Qmarks | All GT_QMARK nodes are eliminated, other than simple ones that do not require control flow. |
compiler.cpp |
| Flowgraph Analysis | BasicBlock predecessors are computed, and must be kept valid. Loops are identified, and normalized, cloned and/or unrolled. |
flowgraph.cpp |
| Normalize IR for Optimization | lvlVar references counts are set, and must be kept valid. Evaluation order of GenTree nodes (gtNext/gtPrev) is determined, and must be kept valid. |
compiler.cpp and lclvars.cpp |
| SSA and Value Numbering Optimizations | Computes liveness (bbLiveIn and bbLiveOut on BasicBlocks), and dominators. Builds SSA for tracked lvlVars. Computes value numbers. |
liveness.cpp |
| Loop Invariant Code Hoisting | Hoists expressions out of loops. | optimizer.cpp |
| Copy Propagation | Copy propagation based on value numbers. | copyprop.cpp |
| Common Subexpression Elimination (CSE) | Elimination of redundant subexressions based on value numbers. | optcse.cpp |
| Assertion Propagation | Utilizes value numbers to propagate and transform based on properties such as non-nullness. | assertionprop.cpp |
| Range analysis | Eliminate array index range checks based on value numbers and assertions | rangecheck.cpp |
| Rationalization | Flowgraph order changes from FGOrderTree to FGOrderLinear. All GT_COMMA, GT_ASG and GT_ADDR nodes are transformed. |
rationalize.cpp |
| Lowering | Register requirements are fully specified (gtLsraInfo). All control flow is explicit. |
lower.cpp, lowerarm.cpp, lowerarm64.cpp and lowerxarch.cpp |
| Register allocation | Registers are assigned (gtRegNum and/or gtRsvdRegs),and the number of spill temps calculated. |
regalloc.cpp and register_arg_convention.cp |
| Code Generation | Determines frame layout. Generates code for each BasicBlock. Generates prolog & epilog code for the method. Emit EH, GC and Debug info. |
codegenarm.cpp, codegenarm64.cpp, codegencommon.cpp, codegenlegacy.cpp, codegenlinear.cpp and codegenxarch.cpp |
pal (Platform Adaptation Layer)
The PAL provides an OS independent layer to give access to common low-level functionality such as:
As .NET was originally written to run on Windows, all the APIs look very similar to the Win32 APIs. However for non-Windows platforms they are actually implemented using the functionality available on that OS. For example this is what PAL code to read/write a file looks like:
int main(int argc, char *argv[])
{
  WCHAR  src[4] = {'f', 'o', 'o', '\0'};
  WCHAR dest[4] = {'b', 'a', 'r', '\0'};
  WCHAR  dir[5] = {'/', 't', 'm', 'p', '\0'};
  HANDLE h;
  unsigned int b;

  PAL_Initialize(argc, (const char**)argv);
  SetCurrentDirectoryW(dir);
  SetCurrentDirectoryW(dir);
  h =  CreateFileW(src, GENERIC_WRITE, FILE_SHARE_READ, NULL, CREATE_NEW, 0, NULL);
  WriteFile(h, "Testing\n", 8, &b, FALSE);
  CloseHandle(h);
  CopyFileW(src, dest, FALSE);
  DeleteFileW(src);
  PAL_Terminate();
  return 0;
}
The PAL does contain some per-CPU assembly code, but it’s only for very low-level functionality, for instance here’s the different implementations of the DebugBreak function:
gc (Garbage Collector)
The GC is clearly a very complex piece of code, lying right at the heart of the CLR, so for more information about what it does I recommend reading the BotR entry on ‘Garbage Collection Design’ and if you’re interested I’ve also written several blog posts looking at its functionality.
However from a source code point-of-view the GC is pretty simple, it’s spread across just 19 .cpp files, but the bulk of the work is in gc.cpp (raw version) all ~37K L.O.C of it!!
If you want to get deeper into the GC code (warning, it’s pretty dense), a good way to start is to search for the occurrences of various ETW events that are fired as the GC moves through the phases outlined in the BotR post above, these events are listed below:
FireEtwGCTriggered(..)FireEtwGCAllocationTick_V1(..)FireEtwGCFullNotify_V1(..)FireEtwGCJoin_V2(..)FireEtwGCMarkWithType(..)FireEtwGCPerHeapHistory_V3(..)FireEtwGCGlobalHeapHistory_V2(..)FireEtwGCCreateSegment_V1(..)FireEtwGCFreeSegment_V1(..)FireEtwBGCAllocWaitBegin(..)FireEtwBGCAllocWaitEnd(..)FireEtwBGCDrainMark(..)FireEtwBGCRevisit(..)FireEtwBGCOverflow(..)FireEtwPinPlugAtGCTime(..)FireEtwGCCreateConcurrentThread_V1(..)FireEtwGCTerminateConcurrentThread_V1(..)
But the GC doesn’t work in isolation, it also requires help from the Execute Engine (EE), this is done via the GCToEEInterface which is implemented in gcenv.ee.cpp.
Local GC and GC Sample
Finally, there are 2 others ways you can get into the GC code and understand what it does.
Firstly there is a GC sample the lets you use the full GC independent of the rest of the runtime. It shows you how to ‘create type layout information in format that the GC expects’, ‘implement fast object allocator and write barrier’ and ‘allocate objects and work with GC handles’, all in under 250 LOC!!
Also worth mentioning is the ‘Local GC’ project, which is an ongoing effort to decouple the GC from the rest of the runtime, they even have a dashboard so you can track its progress. Currently the GC code is too intertwined with the runtime and vica-versa, so ‘Local GC’ is aiming to break that link by providing a set of clear interfaces, GCToOSInterface and GCToEEInterface. This will help with the CoreCLR cross-platform efforts, making the GC easier to port to new OSes.
debug
The CLR is a ‘managed runtime’ and one of the significant components it provides is a advanced debugging experience, via Visual Studio or WinDBG. This debugging experience is very complex and I’m not going to go into it in detail here, however if you want to learn more I recommend you read ‘Data Access Component (DAC) Notes’.
But what does the source look like, how is it laid out? Well the a several main sub-components under the top-level /debug folder:
- dacaccess - the provides the ‘Data Access Component’ (DAC) functionality as outlined in the BotR page linked to above. The DAC is an abstraction layer over the internal structures in the runtime, which the debugger uses to inspect objects/classes
- di - this contains the exposed APIs (or entry points) of the debugger, implemented by
CoreCLRCreateCordbObject(..)in cordb.cpp - ee - the section of debugger that works with the Execution Engine (EE) to do things like stack-walking
- inc - all the interfaces (.h) files that the debugger components implement
All the rest
As well as the main components, there are various other top-level folders in the source, the full list is below:
- binder
- The ‘binder’ is responsible for loading assemblies within a .NET program (except the mscorlib binder which is elsewhere). The ‘binder’ comprises low-level code that controls Assemblies, Application Contexts and the all-important Fusion Log for diagnosing why assemblies aren’t loading!
- classlibnative
- Code for native implementations of many of the core data types in the CoreCLR, e.g. Arrays, System.Object, String, decimal, float and double.
- Also includes all the native methods exposed in the ‘System.Environment’ namespace, e.g.
Environment.ProcessorCount,Environment.TickCount,Environment.GetCommandLineArgs(),Environment.FailFast(), etc
- coreclr
- Contains the different tools that can ‘host’ or run the CLR, e.g.
corerun,coreconsoleorunixcorerun. See How the dotnet CLI tooling runs your code for more info on how these tools work.
- Contains the different tools that can ‘host’ or run the CLR, e.g.
- corefx
- Several classes under the ‘System.Globalization’ namespace have native implementations, in here you will find the code for Calendar Data, Locales, Text Normalisation and Time Zone information.
- dlls
- Wrapper code and build files that control how the various dlls are built. For instance mscoree is the main Execution Engine (EE) and contains the CoreCLR DLL Entrypoint and CoreCLR build definition, likewise mscorrc includes the resource file that houses all the CoreCLR error messages.
- gcdump and gcinfo
- Code that will write-out the
GCInfothat is produced by the JIT to help the GC do it’s job. ThisGCInfoincludes information about the ‘liveness’ of variables within a section of code and whether the method is fully or partially interruptible, which enables the EE to suspend methods when the GC is working.
- Code that will write-out the
- ilasm
- IL (Intermediate Language) Assembler is a tool for converting IL code into a .NET executable, see the MSDN page for more info and usage examples.
- ildasm
- Tool for disassembling a .NET executable into the corresponding IL source code, again, see the MSDN page for info and usage examples.
- inc
- ipcman
- Code that enables the ‘Inter-Process Communication’ (IPC) used in .NET (mostly legacy and probably not cross-platform)
- md
- The MetaData (md) code provides the ability to gather information about methods, classes, types and assemblies and is what makes Reflection possible.
- nativeresources
- A simple tool that is responsible for converting/extracting resources from a Windows Resource File.
- palrt
- The PAL (Platform Adaptation Layer) Run-Time, contains specific parts of the PAL layer.
- scripts
- Several Python scripts for auto-generating various files in the source (e.g. ETW events).
- strongname
- The code for handling ‘strong-naming’, including the signing keys used by the CoreCLR itself.
- ToolBox
- Contains 2 stand-alone tools
- SOS (son-of-strike) the CLR debugging extension that enables reporting of .NET specific information when using WinDBG
- SuperPMI which enables testing of the JIT without requiring the full Execution Engine (EE)
- Contains 2 stand-alone tools
- tools
- Several cmd-line tools that can be used in conjunction with the CoreCLR, e.g. ‘Runtime Meta Data Dump Utility’ and ‘Native Image Generator’ (also known as ‘crossgen’)
- unwinder
- Provides the low-level functionality to make it possible for the debugger and exception handling components to walk or unwind the stack. This is done via 2 functions,
GetModuleBase(..)andGetFunctionEntry(..)which are implemented in CPU architecture-specific code, see amd64, arm, arm64 and i386
- Provides the low-level functionality to make it possible for the debugger and exception handling components to walk or unwind the stack. This is done via 2 functions,
- utilcode
- Shared utility code that is used by the VM, Debugger and JIT
- zap
- ‘ZAP’ is the original code name for NGen (Native Image Generator), a tool that creates native images from .NET IL code.
If you’ve read this far ‘So long and thanks for all the fish’ (YouTube)
Discuss this post on Hacker News and /r/programming