Analysing Pause times in the .NET GC
13 Jan 2017 - 2188 wordsOver the last few months there have been several blog posts looking at GC pauses in different programming languages or runtimes. It all started with a post looking at the latency of the Haskell GC, next came a follow-up that compared Haskell, OCaml and Racket, followed by Go GC in Theory and Practice, before a final post looking at the situation in Erlang.
After reading all these posts I wanted to see how the .NET GC compares to the other runtime implementations.
The posts above all use a similar test program to exercise the GC, based on the message-bus scenario that Pusher initially described, fortunately Franck Jeannin had already started work on a .NET version, so this blog post will make us of that.
At the heart of the test is the following code:
for (var i = 0; i < msgCount; i++)
{
    var sw = Stopwatch.StartNew();
    pushMessage(array, i);
    sw.Stop();
    if (sw.Elapsed > worst)
    {
        worst = sw.Elapsed;
    }
}

private static unsafe void pushMessage(byte[][] array, int id)
{
    array[id % windowSize] = createMessage(id);
}
So we are creating a ‘message’ (that is actually a byte[1024]) and then putting it into a data structure (byte[][]). This is repeated 10 million times (msgCount), but at any one time there are only 200,000 (windowSize) messages in memory, because we overwrite old ‘messages’ as we go along.
We are timing how long it takes to add the message to the array, which should be a very quick operation. It’s not guaranteed that this time will always equate to GC pauses, but it’s pretty likely. However we can also double check the actual GC pause times by using the excellent PerfView tool, to give us more confidence.
Workstation GC vs. Server GC
Unlike the Java GC that is very configurable, the .NET GC really only gives you a few options:
- Workstation
- Server
- Concurrent/Background
So we will be comparing the Server and Workstation modes, but as we want to reduce pauses we are going to always leave Concurrent/Background mode enabled.
As outlined in the excellent post Understanding different GC modes with Concurrency Visualizer, the 2 modes are optimised for different things (emphasis mine):
Workstation GC is designed for desktop applications to minimize the time spent in GC. In this case GC will happen more frequently but with shorter pauses in application threads. Server GC is optimized for application throughput in favor of longer GC pauses. Memory consumption will be higher, but application can process greater volume of data without triggering garbage collection.
Therefore Workstation mode should give us shorter pauses than Server mode and the results bear this out, below is a graph of the pause times at different percentiles, recorded with by HdrHistogram.NET (click for full-size image):
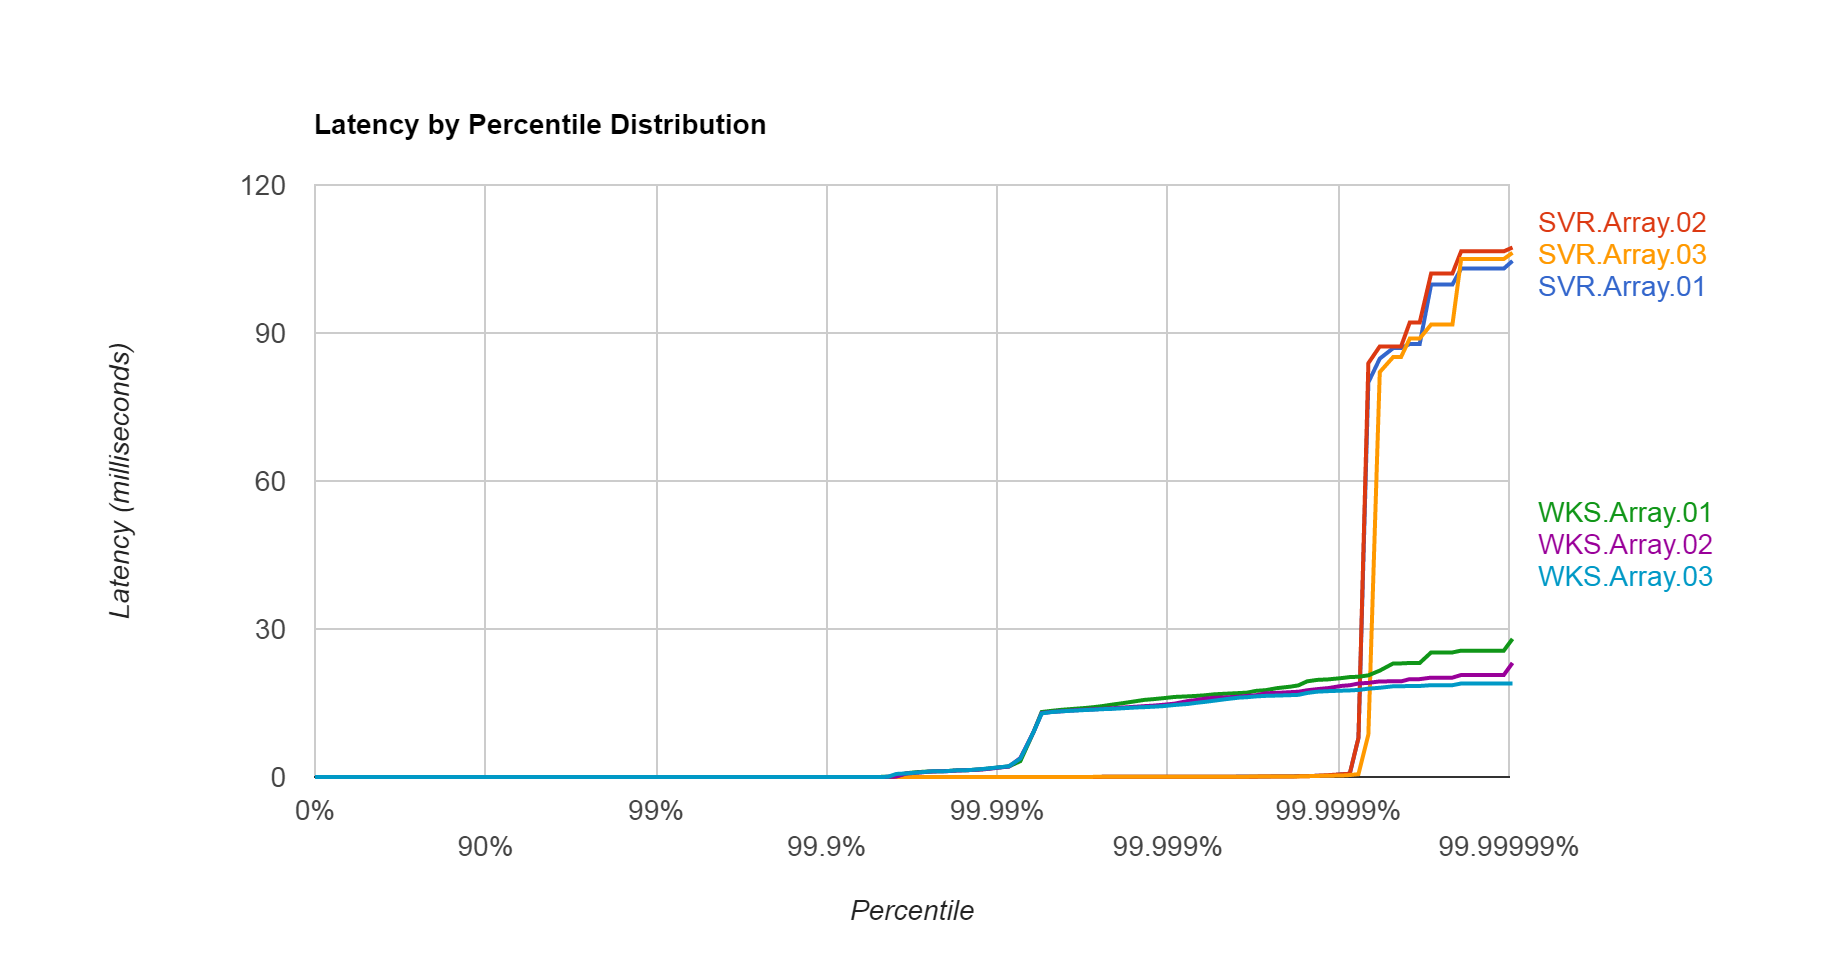
Note that the X-axis scale is logarithmic, the Workstation (WKS) pauses starts increasing at the 99.99%’ile, whereas the Server (SVR) pauses only start at the 99.9999%’ile, although they have a larger maximum.
Another way of looking at the results is the table below, here we can clearly see that Workstation has a-lot more GC pauses, although the max is smaller. But more significantly the total GC pause time is much higher and as a result the overall/elapsed time is twice as long (WKS v. SVR).
Workstation GC (Concurrent) vs. Server GC (Background) (On .NET 4.6 - Array tests - all times in milliseconds)
| GC Mode | Max GC Pause | # GC Pauses | Total GC Pause Time | Elapsed Time | Peak Working Set (MB) |
|---|---|---|---|---|---|
| Workstation - 1 | 28.0 | 1,797 | 10,266.2 | 21,688.3 | 550.37 |
| Workstation - 2 | 23.2 | 1,796 | 9,756.6 | 21,018.2 | 543.50 |
| Workstation - 3 | 19.3 | 1,800 | 9,676.0 | 21,114.6 | 531.24 |
| Server - 1 | 104.6 | 7 | 646.4 | 7,062.2 | 2,086.39 |
| Server - 2 | 107.2 | 7 | 664.8 | 7,096.6 | 2,092.65 |
| Server - 3 | 106.2 | 6 | 558.4 | 7,023.6 | 2,058.12 |
Therefore if you only care about the reducing the maximum pause time then Workstation mode is a suitable option, but you will experience more GC pauses overall and so the throughput of your application will be reduced. In addition, the working set is higher for Server mode as it allocates 1 heap per CPU.
Fortunately in .NET we have the choice of which mode we want to use, according to the fantastic article Modern garbage collection the GO runtime has optimised for pause time only:
The reality is that Go’s GC does not really implement any new ideas or research. As their announcement admits, it is a straightforward concurrent mark/sweep collector based on ideas from the 1970s. It is notable only because it has been designed to optimise for pause times at the cost of absolutely every other desirable characteristic in a GC. Go’s tech talks and marketing materials don’t seem to mention any of these tradeoffs, leaving developers unfamiliar with garbage collection technologies to assume that no such tradeoffs exist, and by implication, that Go’s competitors are just badly engineered piles of junk.
Max GC Pause Time compared to Amount of Live Objects
To investigate things further, let’s look at how the maximum pause times vary with the number of live objects. If you refer back to the sample code, we will still be allocating 10,000,000 message (msgCount), but we will vary the amount that are kept around at any one time by changing the windowSize value. Here are the results (click for full-size image):
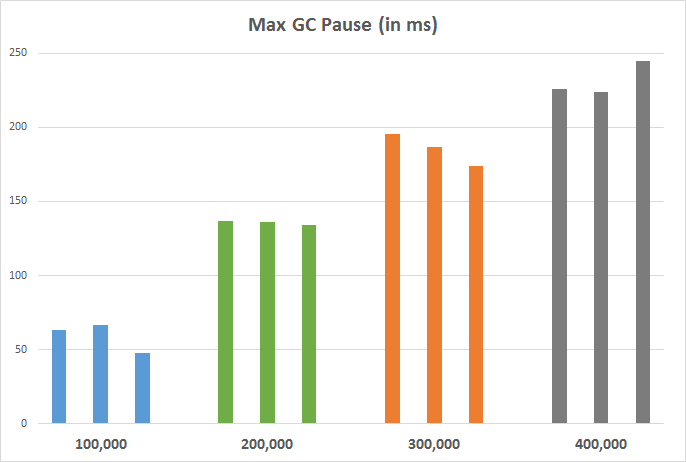
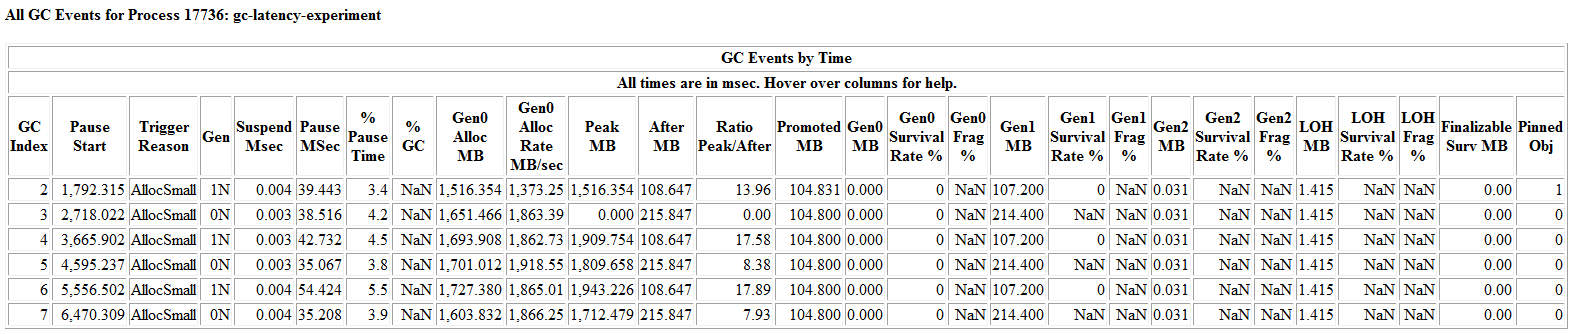
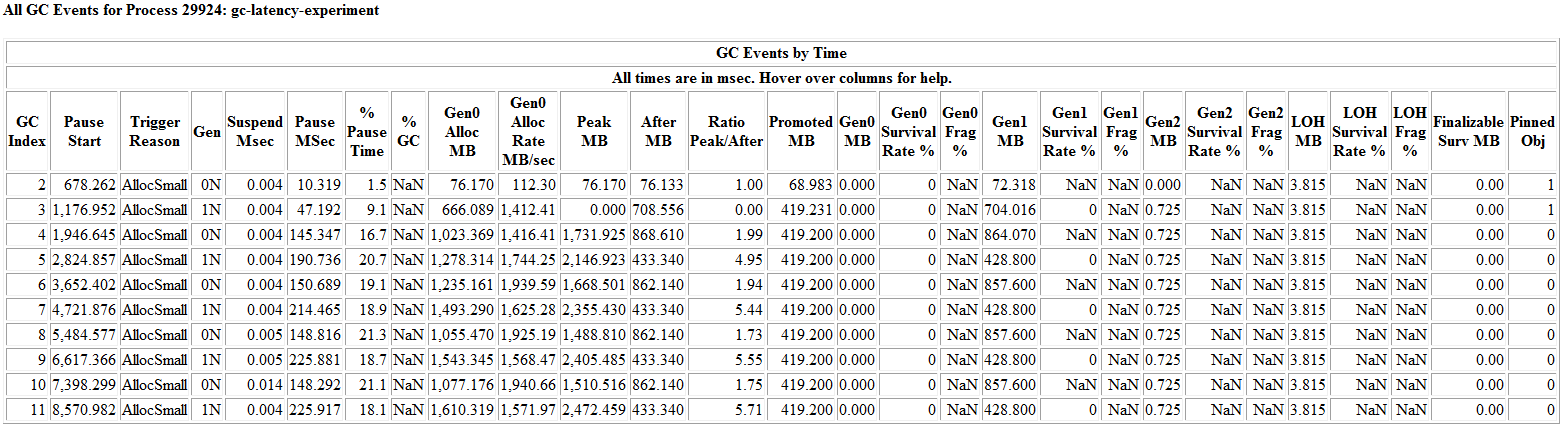
So you can clearly see that the max pause time is proportional (linearly?) to the amount of live objects, i.e. the amount of objects that survive the GC. Why is this that case, well to get a bit more info we will again use PerfView to help us. If you compare the 2 tables below, you can see that the ‘Promoted MB’ is drastically different, a lot more memory is promoted when we have a larger windowSize, so the GC has more work to do and as a result the ‘Pause MSec’ times go up.
| GC Events by Time - windowSize = 100,000 | ||||||||||||
|---|---|---|---|---|---|---|---|---|---|---|---|---|
| All times are in msec. Hover over columns for help. | ||||||||||||
| GC Index | Gen | Pause MSec | Gen0 Alloc MB | Peak MB | After MB | Promoted MB | Gen0 MB | Gen1 MB | Gen2 MB | LOH MB | ||
| 2 | 1N | 39.443 | 1,516.354 | 1,516.354 | 108.647 | 104.831 | 0.000 | 107.200 | 0.031 | 1.415 | ||
| 3 | 0N | 38.516 | 1,651.466 | 0.000 | 215.847 | 104.800 | 0.000 | 214.400 | 0.031 | 1.415 | ||
| 4 | 1N | 42.732 | 1,693.908 | 1,909.754 | 108.647 | 104.800 | 0.000 | 107.200 | 0.031 | 1.415 | ||
| 5 | 0N | 35.067 | 1,701.012 | 1,809.658 | 215.847 | 104.800 | 0.000 | 214.400 | 0.031 | 1.415 | ||
| 6 | 1N | 54.424 | 1,727.380 | 1,943.226 | 108.647 | 104.800 | 0.000 | 107.200 | 0.031 | 1.415 | ||
| 7 | 0N | 35.208 | 1,603.832 | 1,712.479 | 215.847 | 104.800 | 0.000 | 214.400 | 0.031 | 1.415 | ||
| GC Events by Time - windowSize = 400,000 | ||||||||||||
|---|---|---|---|---|---|---|---|---|---|---|---|---|
| All times are in msec. Hover over columns for help. | ||||||||||||
| GC Index | Gen | Pause MSec | Gen0 Alloc MB | Peak MB | After MB | Promoted MB | Gen0 MB | Gen1 MB | Gen2 MB | LOH MB | ||
| 2 | 0N | 10.319 | 76.170 | 76.170 | 76.133 | 68.983 | 0.000 | 72.318 | 0.000 | 3.815 | ||
| 3 | 1N | 47.192 | 666.089 | 0.000 | 708.556 | 419.231 | 0.000 | 704.016 | 0.725 | 3.815 | ||
| 4 | 0N | 145.347 | 1,023.369 | 1,731.925 | 868.610 | 419.200 | 0.000 | 864.070 | 0.725 | 3.815 | ||
| 5 | 1N | 190.736 | 1,278.314 | 2,146.923 | 433.340 | 419.200 | 0.000 | 428.800 | 0.725 | 3.815 | ||
| 6 | 0N | 150.689 | 1,235.161 | 1,668.501 | 862.140 | 419.200 | 0.000 | 857.600 | 0.725 | 3.815 | ||
| 7 | 1N | 214.465 | 1,493.290 | 2,355.430 | 433.340 | 419.200 | 0.000 | 428.800 | 0.725 | 3.815 | ||
| 8 | 0N | 148.816 | 1,055.470 | 1,488.810 | 862.140 | 419.200 | 0.000 | 857.600 | 0.725 | 3.815 | ||
| 9 | 1N | 225.881 | 1,543.345 | 2,405.485 | 433.340 | 419.200 | 0.000 | 428.800 | 0.725 | 3.815 | ||
| 10 | 0N | 148.292 | 1,077.176 | 1,510.516 | 862.140 | 419.200 | 0.000 | 857.600 | 0.725 | 3.815 | ||
| 11 | 1N | 225.917 | 1,610.319 | 2,472.459 | 433.340 | 419.200 | 0.000 | 428.800 | 0.725 | 3.815 | ||
Going ‘off-heap’
Finally, if we really want to eradicate GC pauses in .NET, we can go off-heap. To do that we can write unsafe code like this:
var dest = array[id % windowSize];
IntPtr unmanagedPointer = Marshal.AllocHGlobal(dest.Length);
byte* bytePtr = (byte *) unmanagedPointer;

// Get the raw data into the bytePtr (byte *)
// in reality this would come from elsewhere, e.g. a network packet
// but for the test we'll just cheat and populate it in a loop
for (int i = 0; i < dest.Length; ++i)
{
    *(bytePtr + i) = (byte)id;
}

// Copy the unmanaged byte array (byte*) into the managed one (byte[])
Marshal.Copy(unmanagedPointer, dest, 0, dest.Length);

Marshal.FreeHGlobal(unmanagedPointer);
Note: I wouldn’t recommend this option unless you have first profiled and determined that GC pauses are a problem, it’s called unsafe for a reason.
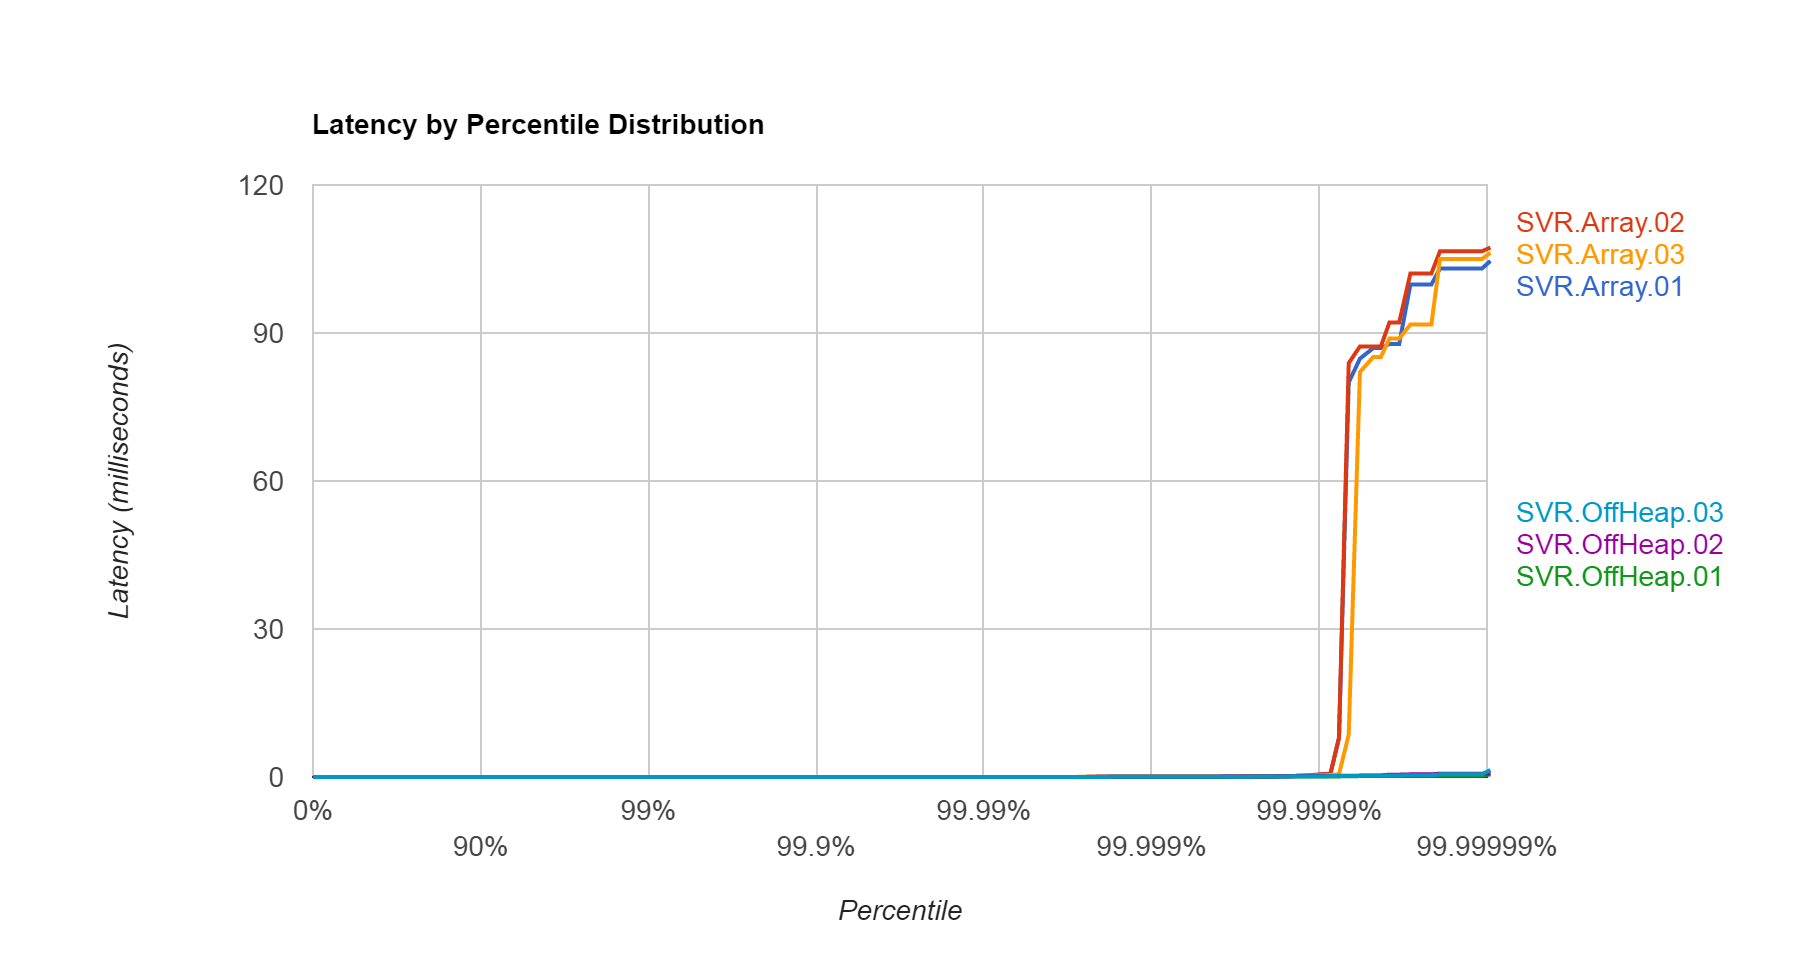
But as the graph shows, it clearly works (the off-heap values are there, honest!!). But it’s not that surprising, we are giving the GC nothing to do (because off-heap memory isn’t tracked by the GC), we get no GC pauses!
To finish let’s get a final work from Maoni Stephens, the main GC dev on the .NET runtime, from GC ETW events – 2 – Maoni’s WebLog:
It doesn’t even mean for the longest individual GC pauses you should always look at full GCs because full GCs can be done concurrently, which means you could have gen2 GCs whose pauses are shorter than ephemeral GCs. And even if full GCs did have longest individual pauses, it still doesn’t necessarily mean you should only look at them because you might be doing these GCs very infrequently, and ephemeral GCs actually contribute to most of the GC pause time if the total GC pauses are your problem.
Note: Ephemeral generations and segments - Because objects in generations 0 and 1 are short-lived, these generations are known as the ephemeral generations.
So if GC pause times are a genuine issue in your application, make sure you analyse them correctly!
Discuss this post in /r/csharp, /r/programming and Hacker News