The Art of Benchmarking (Updated 2014-09-23)
19 Sep 2014 - 2662 wordstl;dr
Benchmarking is hard, it’s very easy to end up “not measuring, what you think you are measuring”
Update (2014-09-23): Sigh - I made a pretty big mistake in these benchmarks, fortunately Reddit user zvrba corrected me:

Yep, can’t argue with that, see Results and Resources below for the individual updates.
Intro to Benchmarks
To start with, lets clarify what types of benchmarks we are talking about. Below is a table from the DEVOXX talk by Aleksey Shipilev, who works on the Java Micro-benchmarking Harness (JMH)
- kilo: > 1000 s, Linpack
- ????: 1…1000 s, SPECjvm2008, SPECjbb2013
- milli: 1…1000 ms, SPECjvm98, SPECjbb2005
- micro: 1…1000 us, single webapp request
- nano: 1…1000 ns, single operations
- pico: 1…1000 ps, pipelining
He then goes on to say:
- Millibenchmarks are not really hard
- Microbenchmarks are challenging, but OK
- Nanobenchmarks are the damned beasts!
- Picobenchmarks…
This post is talking about micro and nano benchmarks, that is ones where the code we are measuring takes microseconds or nanoseconds to execute.
First attempt
Let’s start with a nice example available from Stack Overflow:
static void Profile(string description, int iterations, Action func)
{
    // clean up
    GC.Collect();
    GC.WaitForPendingFinalizers();
    GC.Collect();

    // warm up
    func();

    var watch = Stopwatch.StartNew();
    for (int i = 0; i < iterations; i++)
    {
        func();
    }
    watch.Stop();
    Console.Write(description);
    Console.WriteLine("Time Elapsed {0} ms",
                      watch.Elapsed.TotalMilliseconds);
}
You then use it like this:
Profile("a description", how_many_iterations_to_run, () =>
{
   // ... code being profiled
});
Now there is a lot of good things that this code sample is doing:
- Eliminating the overhead of the .NET GC (as much as possible), by making sure it has run before the timing takes place
- Calling the function that is being profiled, outside the timing loop, so that the overhead of the .NET JIT Compiler isn’t included in the benchmark itself. The first time a function is called the JITter steps in and converts the code from IL into machine code, so that it can actually be executed by the CPU.
- Using
Stopwatchrather thanDateTime.Now, Stopwatch is a high-precision timer with a low-overhead, DateTime.Now isn’t! - Running a lot of iterations of the code (100,000’s), to give an accurate measurement
Now far be it from me to criticise a highly voted Stack Overflow answer, but that’s exactly what I’m going to do! I should add that for a whole range of scenarios the Stack Overflow code is absolutely fine, but it does have it’s limitations. There are several situations where this code doesn’t work, because it fails to actually profile the code you want it to.
Baseline benchmark
But first let’s take a step back and look at the simplest possible case, with all the code inside the function. We’re going to measure the time that Math.Sqrt(..) takes to execute, nice and simple:
static void ProfileDirect(string description, int iterations)
{
    // clean up
    GC.Collect();
    GC.WaitForPendingFinalizers();
    GC.Collect();

    // warm up
    Math.Sqrt(123.456);

    var watch = new Stopwatch();
    watch.Start();
    for (int i = 0; i < iterations; i++)
    {
        Math.Sqrt(123.456);
    }
    watch.Stop();
    Console.WriteLine("ProfileDirect - " + description);
    Console.WriteLine(
        "{0:0.00} ms ({1:N0} ticks) (over {2:N0} iterations), {3:N0} ops/milliseconds",
        watch.ElapsedMilliseconds, watch.ElapsedTicks, iterations,
        (double)iterations / watch.ElapsedMilliseconds);
}
And the results:
ProfileDirect - 2.00 ms (7,822 ticks) (over 10,000,000 iterations), 5,000,000 ops/millisecond
That’s 5 million operations per millisecond, I know CPU’s are fast, but that seems quite high!
For reference, the assembly code that the JITter produced is below, from this you can see that there is no sqrt instruction as we’d expect there to be. So in effect we are timing an empty loop!
;   91:             var watch = new Stopwatch();
000000a6  lea         rcx,[5D3EBA90h]
000000ad  call        000000005F6722F0
000000b2  mov         r12,rax
000000b5  mov         rcx,r12
000000b8  call        000000005D284EF0
;   92:             watch.Start();
000000bd  mov         rcx,r12
000000c0  call        000000005D284E60
;   93:             for (int i = 0; i < iterations; i++)
000000c5  mov         r13d,dword ptr [rbp+58h]
000000c9  test        r13d,r13d
000000cc  jle         00000000000000D7
000000ce  xor         eax,eax
000000d0  inc         eax
000000d2  cmp         eax,r13d
000000d5  jl          00000000000000D0
;   97:             }
;   98:             watch.Stop();
000000d7  mov         rcx,r12
000000da  call        000000005D32CBD0
;   99:             Console.WriteLine(description + " (ProfileDirect)");
Note: To be able to get the optimised version of the assembly code that JITter produces, see this MSDN page. If you just debug the code normally in Visual Studio, you only get the un-optimised code, which doesn’t help at all.
Dead-code elimination
One of the main problems with writing benchmarks is that you are often fighting against the just-in-time (JIT) compiler, which is trying to optimise the code as much as it can. One of the many things is does, is to remove code that it thinks is not needed, or to be more specific, code it thinks has no side-effects. This is non-trivial to do, there’s some really tricky edge-cases to worry about, aside from the more obvious problem of knowing which code causes side-effects and which doesn’t. But this is exactly what is happening in the original profiling code.
Aside: For a full list of all the optimisations that the .NET JIT Compiler performs, see this very thorough SO answer.
So let’s fix the original code, by storing the result of Math.Sqrt in a variable:
private static double result;
static void ProfileDirect(string description, int iterations)
{
    // clean up
    GC.Collect();
    GC.WaitForPendingFinalizers();
    GC.Collect();

    // warm up
    Math.Sqrt(123.456);

    var watch = new Stopwatch();
    watch.Start();
    for (int i = 0; i < iterations; i++)
    {
        result = Math.Sqrt(123.456);
    }
    watch.Stop();
    Console.WriteLine("ProfileDirect - " + description);
    Console.WriteLine(
        "{0:0.00} ms ({1:N0} ticks) (over {2:N0} iterations), {3:N0} ops/milliseconds",
        watch.ElapsedMilliseconds, watch.ElapsedTicks,
        iterations, (double)iterations / watch.ElapsedMilliseconds);
}
Note: result has to be a class-level field, it can’t be local to the method, i.e. double result = Math.Sqrt(123.456). This is because the JITter is clever enough to figure out that the local field isn’t accessed outside of the method and optimise it away, again you are always fighting against the JITter.
So now the results look like this, which is a bit more sane!
ProfileDirectWithStore - 68.00 ms (180,801 ticks) (over 10,000,000 iterations), 147,059 ops/millisecond
Loop-unrolling
One other thing you have to look out for is whether or not the time spent running the loop is dominating the code you want to profile. In this case Math.Sqrt() ends up as a few assembly instructions, so less time is spent executing that, compared to the instructions needed to make for (..) loop happen.
To fix this we can unroll the loop, so that we execute Math.Sqrt(..) multiple times per loop, but to compensate we run the loop less times. The code now looks like this:
static void ProfileDirectWithStoreUnrolledx10(string description, int iterations)
{
    // clean up
    GC.Collect();
    GC.WaitForPendingFinalizers();
    GC.Collect();

    // warm up
    var temp = Math.Sqrt(123.456);

    var watch = new Stopwatch();
    watch.Start();
    var loops = iterations / 10;
    for (int i = 0; i < loops; i++)
    {
        result = Math.Sqrt(123.456);
        result = Math.Sqrt(123.456);
        result = Math.Sqrt(123.456);
        result = Math.Sqrt(123.456);
        result = Math.Sqrt(123.456);
        result = Math.Sqrt(123.456);
        result = Math.Sqrt(123.456);
        result = Math.Sqrt(123.456);
        result = Math.Sqrt(123.456);
        result = Math.Sqrt(123.456);
    }
    watch.Stop();
    Console.WriteLine("ProfileDirectWithStoreUnrolled x10 - " + description);
    Console.WriteLine(
        "{0:0.00} ms ({1:N0} ticks) (over {2:N0} iterations), {3:N0} ops/milliseconds",
        watch.ElapsedMilliseconds, watch.ElapsedTicks, iterations,
        (double)iterations / watch.ElapsedMilliseconds);
}
And now the result is:
ProfileDirectWithStoreUnrolled x10 - 47.00 ms (124,582 ticks) (over 10,000,000 iterations), 212,766 ops/millisecond
So we are now doing 212,766 ops/millisecond, compared to 147,059 when we didn’t unroll the loop. I did some further tests to see if unrolling the loop 20 or 40 times made any further difference and if did continue to get slightly faster, but the change was not significant.
Results
These results were produced by running the code in RELEASE mode and launching the application from outside Visual Studio, also the .exe’s were explicitly compiled in x86/x64 mode and optimisations were turned on. To ensure I didn’t mess up, I included some diagnostic code in the application, that prints out a message in red if anything is setup wrong. Finally these tests were run with .NET 4.5, so the results will be different under other versions, the JIT compilers have brought in more and more optimisations over time.
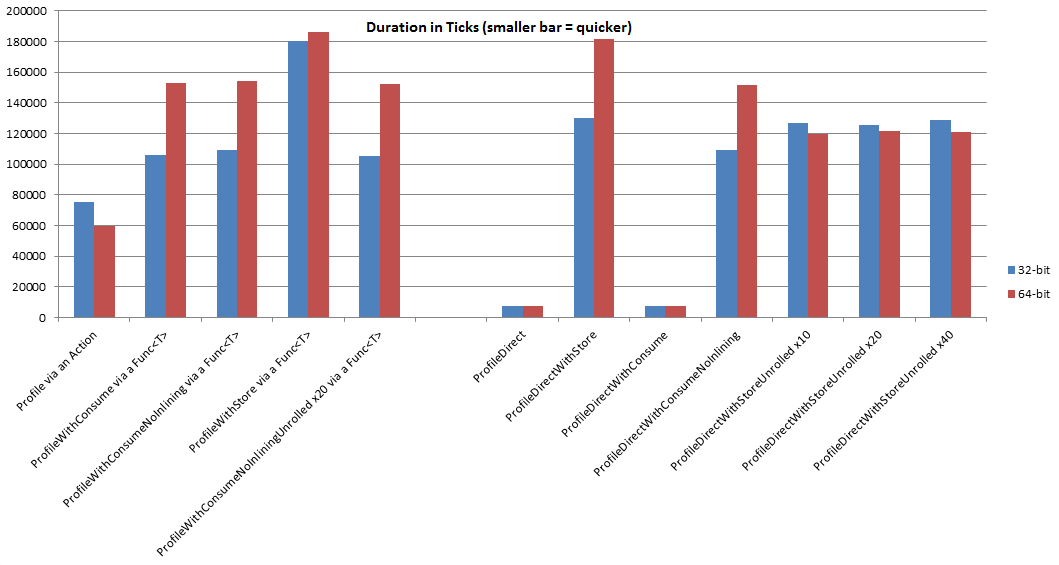
As seen in the chart below the best results for 64-bit (red) were achieved when we unrolled the loop (“ProfileDirectWithStoreUnrolled”). There are other other results that were faster, but in these the actual code we wanted to profile was optimised away by the JITter (“Profile via an Action”, “ProfileDirect” and “ProfileDirectWithConsume”).
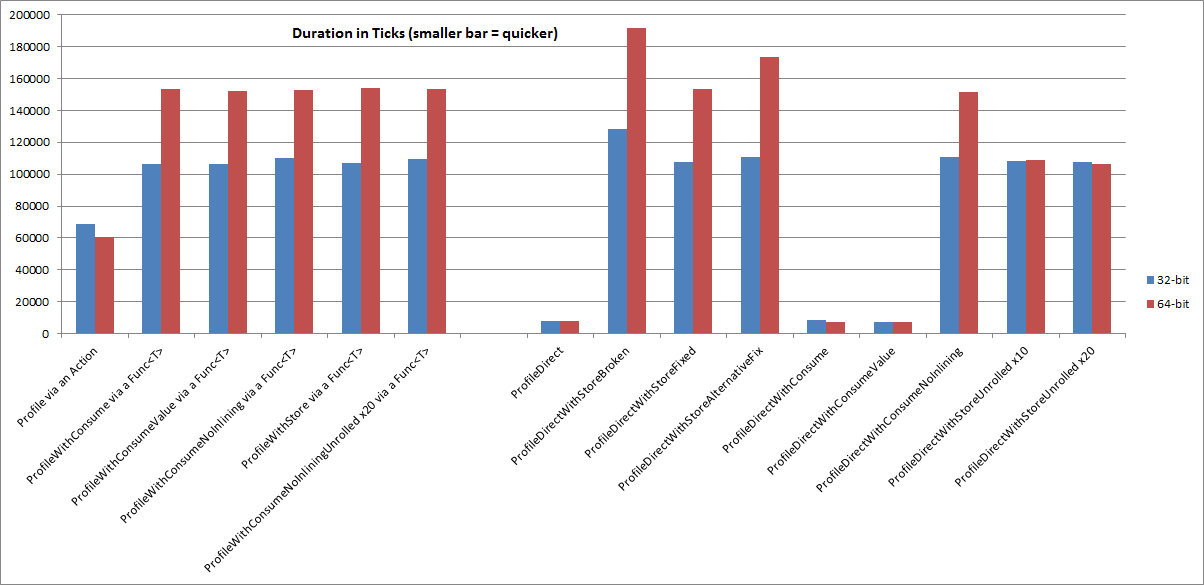
Update (2014-09-23): The correct results are in the chart below
CLR JIT Compiler - 32-bit v. 64-bit
You might have noticed that the 32-bit and 64-bit results in the graph vary per test, why is this? Well one reason is the fundamental difference between 32-bit and 64-bit, 64-bit has 8 byte pointers compared to 4 byte ones in 32-bit. But the larger difference is that in .NET there are 2 different JIT compilers, with different goals
The .NET 64-bit JIT was originally designed to produce very efficient code throughout the long run of a server process. This differs from the .NET x86 JIT, which was optimized to produce code quickly so that the program starts up fast. Taking time to compile efficient code made sense when 64-bit was primarily for server code. But “server code” today includes web apps that have to start fast. The 64-bit JIT currently in .NET isn’t always fast to compile your code, meaning you have to rely on other technologies such as NGen or background JIT to achieve fast program startup.
However one benefit of RyuJIT (the next generation JIT Compiler) is that it’s a common code base for 32-bit and 64-bit, so when it comes out, everything may change! (BTW RyuJIT, what a great name)
For reference the assembly code that is generated in both cases is available:
- 32-bit version where the fsqrt instruction is used
- 64-bit version where the sqrtsd instruction is used
But there’s still more to do
Even though this post is over 2000 words longs, it still hasn’t covered:
- How you store and present the results
- How users can write their own benchmarks
- Multi-threaded benchmarks
- Allowing state in benchmarks
And there’s even more than that to worry about, see the complete list below, taken from this discussion thread on the excellent mechanical sympathy group:
- Dynamic selection of benchmarks.
- Loop optimizations.
- Dead-code elimination.
- Constant foldings
- Non-throughput measures
- Synchronize iterations
- Multi-threaded sharing
- Multi-threaded setup/teardown
- False-sharing
- Asymmetric benchmarks
- Inlining
Note: these are only the headings, the discussion goes into a lot of detail about how these issues are solved in JMH. But whilst the JVM and the CLR do differ in a number of ways, a lot of what is said applies to writing benchmarks for the CLR.
The summary from Aleksey sums it all up really!
The benchmarking harness business is very hard, and very non-obvious. My own experience tells me even the smartest people make horrible mistakes in them, myself included. We try to get around that by fixing more and more things in JMH as we discover more, even if that means significant API changes….
The job for a benchmark harness it to provide [a] reliable benchmarking environment …
Resources
Here’s a list of all the code samples and other data used in making this post:
- The full benchmarking code Updated (2014-09-23)
- Profile via an
Action - Profile Direct
- Profile Direct, storing the result (BROKEN)
- Profile Direct, storing the result (FIXED)
- Profile Direct, storing the result, unrolled 10 times
- Spreadsheet of results Updated (2014-09-23)
- Generated assembly code Updated (2014-09-23):
- Profile via a
Action - Profile Direct
- Profile Direct and storing the result (BROKEN)
- Profile Direct and storing the result (FIXED)
Further Reading
There’s lots of really good information out there related to writing benchmarks and understanding what the .NET JIT compiler is doing, below are just some of the links I’ve found:
- Writing good benchmarks
- http://www.yoda.arachsys.com/csharp/benchmark.html
- http://blogs.msmvps.com/jonskeet/2009/01/26/benchmarking-made-easy/
- http://blogs.msdn.com/b/vancem/archive/2009/02/06/measureit-update-tool-for-doing-microbenchmarks.aspx
- http://measureitdotnet.codeplex.com/
- JIT Optimisations, including method in-lining and dead code eliminations
- http://blogs.microsoft.co.il/sasha/2007/02/27/jit-optimizations-inlining-and-interface-method-dispatching-part-1-of-n/
- http://blogs.microsoft.co.il/sasha/2007/08/12/jit-optimizations-inlining-and-interface-method-dispatching-part-2-of-n/
- http://blogs.microsoft.co.il/sasha/2012/01/20/aggressive-inlining-in-the-clr-45-jit/
- http://blogs.microsoft.co.il/sasha/2012/06/22/micro-benchmarking-done-wrong-and-for-the-wrong-reasons/
- http://blogs.msdn.com/b/ericgu/archive/2004/01/29/64717.aspx
- http://blogs.msdn.com/b/jmstall/archive/2006/03/13/dead-code-elimination.aspx
- http://blogs.msdn.com/b/vancem/archive/2008/08/19/to-inline-or-not-to-inline-that-is-the-question.aspx
- http://stackoverflow.com/questions/4043821/performance-differences-between-debug-and-release-builds/4045073#4045073
- Inspecting generated assembly code
- http://blogs.msdn.com/b/vancem/archive/2006/02/20/535807.aspx
- http://www.cuttingedge.it/blogs/steven/downloads/Program_InlinableMethodTests.cs
- http://www.philosophicalgeek.com/2014/07/25/using-windbg-to-answer-implementation-questions-for-yourself-can-a-delegate-invocation-be-inlined/