Know thy .NET object memory layout (Updated 2014-09-03)
04 Jul 2014 - 1726 wordsApologies to Nitsan Wakart, from whom I shamelessly stole the title of this post!
tl;dr
The .NET port of HdrHistogram can control the field layout within a class, using the same technique that the original Java code does.
Recently I’ve spent some time porting HdrHistogram from Java to .NET, it’s been great to learn a bit more about Java and get a better understanding of some low-level code. In case you’re not familiar with it, the goals of HdrHistogram are to:
- Provide an accurate mechanism for measuring latency at a full-range of percentiles (99.9%, 99.99% etc)
- Minimising the overhead needed to perform the measurements, so as to not impact your application
You can find a full explanation of what is does and how point 1) is achieved in the project readme.
Minimising overhead
But it’s the 2nd of the points that I’m looking at in this post, by answering the question
How does HdrHistogram minimise its overhead?
But first it makes sense to start with the why, well it turns out it’s pretty simple. HdrHistogram is meant for measuring low-latency applications, if it had a large overhead or caused the GC to do extra work, then it would negatively affect the performance of the application is was meant to be measuring.
Also imagine for a minute that HdrHistogram took 1/10,000th of a second (0.1 milliseconds or 100,000 nanoseconds) to record a value. If this was the case you could only hope to accurately record events lasting down to a millisecond (1/1,000th of a second), anything faster would not be possible as the overhead of recording the measurement would take up too much time.
As it is HdrHistogram is much faster than that, so we don’t have to worry! From the readme:
Measurements show value recording times as low as 3-6 nanoseconds on modern (circa 2012) Intel CPUs.
So how does it achieve this, well it does a few things:
- It doesn't do any memory allocations when storing a value, all allocations are done up front when you create the histogram. Upon creation you have to specify the range of measurements you would like to record and the precision. For instance if you want to record timings covering the range from 1 nanosecond (ns) to 1 hour (3,600,000,000,000 ns), with 3 decimal places of resolution, you would do the following:
Histogram histogram = new Histogram(3600000000000L, 3); - Uses a few low-level tricks to ensure that storing a value can be done as fast as possible. For instance putting the value in the right bucket (array location) is a constant lookup (no searching required) and on top of that it makes use of some nifty bit-shifting to ensure it happens as fast as possible.
- Implements a slightly strange class-hierarchy to ensure that fields are laid out in the right location. It you look at the source you have AbstractHistogram and then the seemingly redundant class AbstractHistogramBase, why split up the fields up like that?
Well the comments give it away a little bit, it's due to false-sharing
False sharing
Update (2014-09-03): As pointed out by Nitsan in the comments, I got the wrong end of the stick with this entire section. It’s not about false-sharing at all, it’s the opposite, I’ll quote him to make sure I get it right this time!
The effort made in HdrHistogram towards controlling field ordering is not about False Sharing but rather towards ensuring certain fields are more likely to be loaded together as they are clumped together, thus avoiding a potential extra read miss.
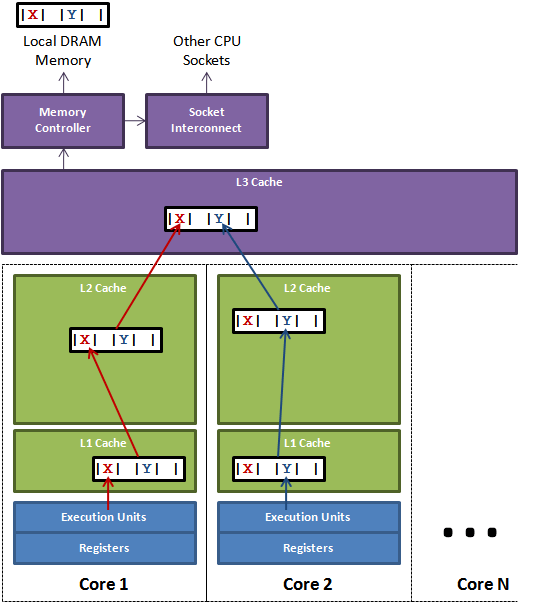
So what is false sharing, to find out more I recommend reading Martin Thompson’s excellent post and this equally good one from Nitsan Wakart. But if you’re too lazy to do that, it’s summed up by the image below (from Martin’s post).
Image from the Mechanical Sympathy blog
The problem is that a CPU pulls data into its cache in lines, even if your code only wants to read a single variable/field. If 2 threads are reading from 2 fields (X and Y in the image) that are next to each other in memory, the CPU running a thread will invalidate the cache of the other CPU when it pulls in a line of memory. This invalidation costs time and in high-performance situations can slow down your program.
The opposite is also true, you can gain performance by ensuring that fields you know are accessed in succession are located together in memory. This means that once the first field is pulled into the CPU cache, subsequent accesses will be cheaper as the fields will be “Hot”. It is this scenario HdrHistogram is trying to achieve, but how do you know that fields in a .NET object are located together in memory?
Analysing the memory layout of a .NET Object
To do this you need to drop down into the debugger and use the excellent SOS or Son-of-Strike extension. This is because the .NET JITter is free to reorder fields as it sees fit, so the order you put the fields in your class does not determine the order they end up. The JITter changes the layout to minimise the space needed for the object and to make sure that fields are aligned on byte boundaries, it does this by packing them in the most efficient way.
To test out the difference between the Histogram with a class-hierarchy and without, the following code was written (you can find HistogramAllInOneClass in this gist):
Histogram testHistogram = new Histogram(3600000000000L, 3);
HistogramAllInOneClass combinedHistogram = new HistogramAllInOneClass();

Debugger.Launch();

GC.KeepAlive(combinedHistogram); // put a breakpoint on this line
GC.KeepAlive(testHistogram);
Then to actually test it, you need to perform the following steps:
- Set the build to Release and x86
- Build the test and then launch your .exe from OUTSIDE Visual Studio (VS), i.e. by double-clicking on it in Windows Explorer. You must not be debugging in VS when it starts up, otherwise the .NET JITter won't perform any optimisations.
- When the "Just-In-Time Debugger" prompt pops up, select the instance of VS that is already opened (not a NEW one)
- Then check "Manually choose the debugging engines." and click "Yes"
- Finally make sure "Managed (...)", "Native" AND "Managed Compatibility Mode" are checked
Once the debugger has connected back to VS, you can type the following commands in the “Immediate Window”:
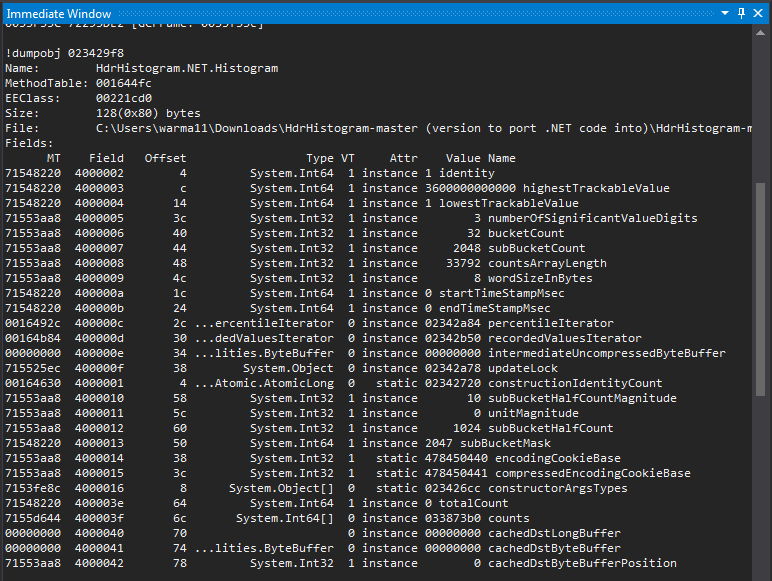
.load sos!DumpStackObjectsDumpObj <ADDRESS>(where ADDRESS is the the value from the "Object" column in Step 2.)
If all that works, you will end up with an output like below:
Update (2014-09-03)
Since first writing this blog post, I came across a really clever technique for getting the offsets of fields in code, something that I initially thought was impossible. The full code to achieve this comes from the Jil JSON serialiser and was written to ensure that it accessed fields in the most efficient order.
It is based on a very clever trick, it dynamically emits IL code, making use of the Ldflda instruction. This is code you could not write in C#, but are able to write directly in IL.
The ldflda instruction pushes the address of a field located in an object onto the stack. The object must be on the stack as an object reference (type O), a managed pointer (type &), an unmanaged pointer (type native int), a transient pointer (type *), or an instance of a value type. The use of an unmanaged pointer is not permitted in verifiable code. The object's field is specified by a metadata token that must refer to a field member.
By putting this code into my project, I was able to verify that it gives exactly the same field offsets that you can see when using the SOS technique (above). So it’s a nice technique and the only option if you want to get this information without having to drop-down into a debugger.
Results
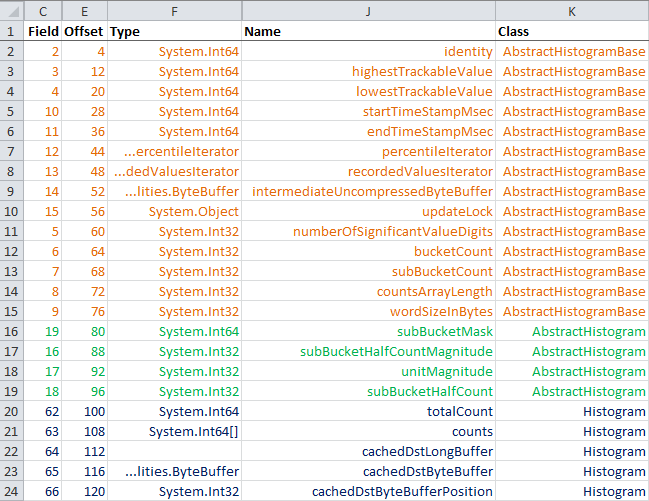
After all these steps we end up with the results shown in the images below, where the rows are ordered by the “Offset” value.
AbstractHistogramBase.cs -> AbstractHistogram.cs -> Histogram.cs
You can see that with the class hierarchy in place, the fields remain grouped as we want them to (shown by the orange/green/blue highlighting). What is interesting is that the JITter has still rearranged fields within a single group, preferring to put Int64 (long) fields before Int32 (int) fields in this case. This is seen by comparing the ordering of the “Field” column with the “Offset” one, where the values in the “Field” column represent the original ordering of the fields as they appear in the source code.
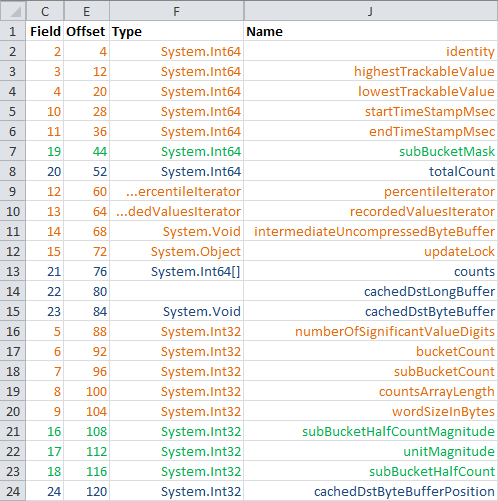
However when we put all the fields in a single class, we lose the grouping:
Equivalent fields all in one class
Alternative Technique
To achieve the same effect you can use the StructLayout attribute, but this requires that you calculate all the offsets yourself, which can be cumbersome:
[StructLayout(LayoutKind.Explicit, Size = 28, CharSet = CharSet.Ansi)]
public class HistogramAllInOneClass
{
  // "Cold" accessed fields. Not used in the recording code path:
  [FieldOffset(0)]
  internal long identity;

  [FieldOffset(8)]
  internal long highestTrackableValue;
  [FieldOffset(16)]
  internal long lowestTrackableValue;
  [FieldOffset(24)]
  internal int numberOfSignificantValueDigits;

  ...
}
If you are interested, the full results of this test are available


