Measuring the impact of the .NET Garbage Collector
18 Jun 2014 - 1534 wordsThere is an update to this post, based on feedback I received.
In my last post I talked about the techniques that the Roslyn team used to minimise the effect of the Garbage Collector (GC). Firstly I guess its worth discussing what the actual issue is.
GC Pauses and Latency
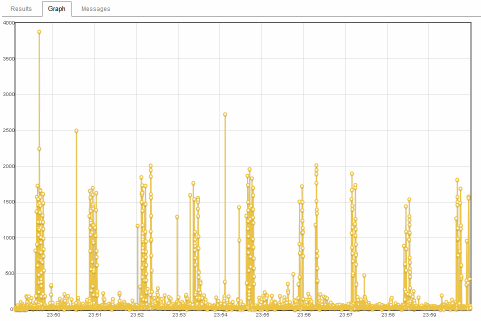
In early versions of the .NET CLR, garbage collection was a “Stop the world” event, i.e. before a GC could happen all the threads in your program had to be brought to a safe place and suspended. If your ASP.NET MVC app was in the middle of serving a request, it would not complete until after the GC finished and the latency for that user would be much higher than normal. This is exactly the issue that Stackoverflow ran into a few years ago, in their battles with the .NET Garbage Collector. If you look at the image below (from that blog post), you can see the spikes in response times of over 1 second, caused by Gen 2 collections.
However in the .NET framework 4.5 there were enhancements to the GC brought in that can help mitigate these (emphasis mine)
The new background server GC in the .NET Framework 4.5 offloads much of the GC work associated with a full blocking collection to dedicated background GC threads that can run concurrently with user code, resulting in much shorter (less noticeable) pauses. One customer reported a 70% decrease in GC pause times.
But as you can see from the quote, this doesn’t get rid of pauses completely, it just minimises them. Even the SustainedLowLatency mode isn’t enough, “The collector tries to perform only generation 0, generation 1, and concurrent generation 2 collections. Full blocking collections may still occur if the system is under memory pressure.” If you want a full understanding of the different modes, you can see some nice diagrams on this MSDN page.
I’m not in any way being critical or dismissive of these improvements. GC is a really hard engineering task, you need to detect and clean-up the unused memory of a program, whilst it’s running, ensuring that you don’t affect it’s correctness in any way and making sure you add as little overhead as possible. Take a look at this video for some idea of what’s involved. The .NET GC is a complex and impressive piece of engineering, but there are still some scenarios where it can introduce pauses to your program.
Aside: In the Java world there is a commercial Pauseless Garbage Collector available from Azul Systems. It uses a patented technique to offer “Predictable, consistent garbage collection (GC) behavior” and “Predictable, consistent application response times”, but there doesn’t seem to be anything like that in the .NET space.
Detecting GC Pauses
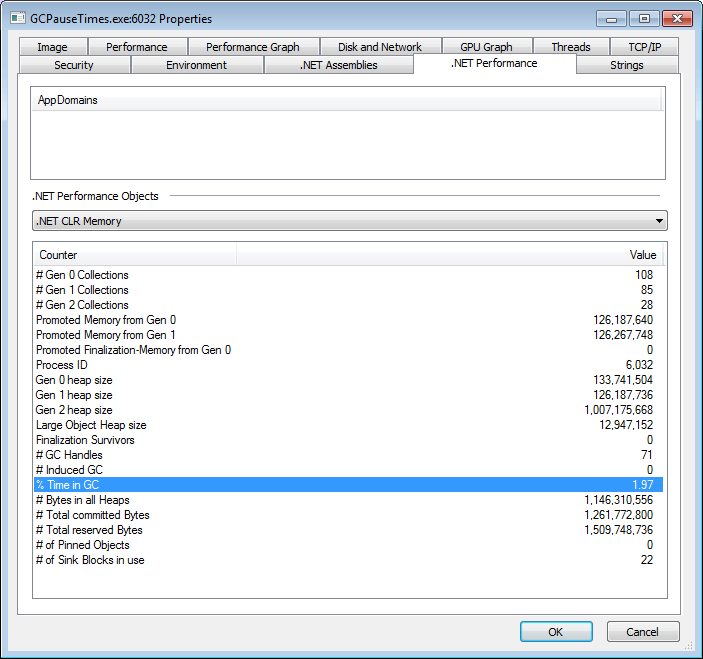
But how do you detect GC pauses, well the first thing to do is take a look at the properties of the process using the excellent Process Explorer tool from Sysinternals (imagine Task Manager on steroids). It will give you a summary like the one below, the number of Gen 0/1/2 Collections and % Time in GC are the most interesting values to look at.
But the limitation of this is that it has no context, what % of time in GC is too high, how many Gen 2 collections are too many? What effect does GC actually have on your program, in terms of pauses that a customer will experience?
jHiccup and HdrHistogram
To gain a better understanding, I’ve used some of the ideas from the excellent jHiccup Java tool. Very simply, it starts a new thread in which the following code runs:
var timer = new Stopwatch();
while (true)
{
  timer.Restart();
  Thread.Sleep(1);
  timer.Stop();
  // allow a little bit of leeway
  if (timer.ElapsedMilliseconds > 2)
  {
    // Record the pause
    _histogram.recordValue(timer.ElapsedMilliseconds);
  }
}
Any pauses that this thread experiences will also be seen by the other threads running in the program and whilst these pauses aren’t guaranteed to be caused by the GC, it’s the most likely culprit.
Note: this uses the .NET port of the Java HdrHistogram, a full explanation of what HdrHistogram offers and how it works is available in the Readme. But the summary is that it offers a non-intrusive way of collecting samples in a histogram, so that you can then produce a graph of the 50%/99%/99.9%/99.99% percentiles. It does this by allocating all the memory it needs up front, so after start-up it performs no allocations during usage. The benefit of recording full percentile information like this is that you get a much fuller view of any outlying values, compared to just recording a simple average.
To trigger garbage collection, the test program also runs several threads, each executing the code below. In a loop, each thread creates a large string and a byte array, to simulate what a web server might be doing when generating a response to a web request (for instance from de-serialising some Json and creating a HTML page). Then to ensure that the objects are kept around long enough, they are both put into a Least Recently Used (LRU) cache, that holds the 2000 most recent items.
processingThreads[i] = new Thread(() =>
{
  var threadCounter = 0;
  while (true)
  {
    var text = new string((char)random.Next(start, end + 1), 1000);
    stringCache.Set(text.GetHashCode(), text);

    // Use 80K, If we are > 85,000 bytes = LOH and we don't want these there
    var bytes = new byte[80 * 1024];
    random.NextBytes(bytes);
    bytesCache.Set(bytes.GetHashCode(), bytes);

    threadCounter++;
    Thread.Sleep(1); // So we don't thrash the CPU!!!!
  }
});
Test Results
The test was left running for 10 mins, in each of the following GC modes:
- Workstation Batch (non-concurrent)
- Workstation Interactive (concurrent)
- Server Batch (non-concurrent)
- Server Interactive (concurrent)
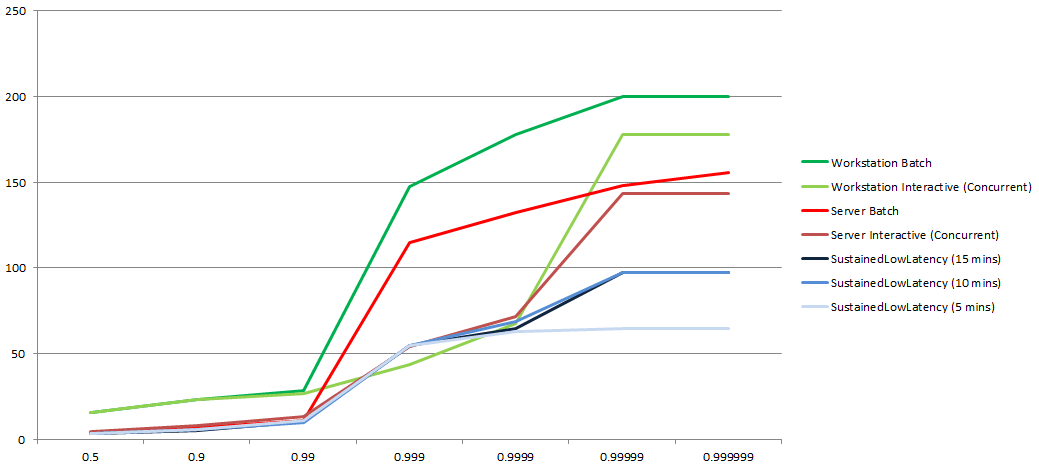
The results are below, you can clearly see that Server modes offer lower pauses than the Workstation modes and that Interactive (concurrent) mode is also an improvement over Batch mode. The graph shows pause times on the Y axis (so lower is better) and the X axis plots the percentiles, scaled logarithmically.
If we take a closer look at just the 99% percentile, i.e. the value (at) which “1 in 100” pauses are less than, the difference is even clearer. Here you can see that the Workstation modes have pauses upto 25 milliseconds, compared to 10 milliseconds for the Server modes.
SustainedLowLatency Mode
As a final test, the program was run using the new SustainedLowLatency mode, to see what effect that has. In the graph below you can see this offers lower pause times, although it isn’t able to sustain these for an unlimited period of time. After 10 minutes we start to see longer pauses compared to those we saw when running the test for just 5 minutes.
It’s worth noting that there is a trade-off to take into account when using this mode, SustainedLowLatency mode is:
For applications that have time-sensitive operations for a contained but potentially longer duration of time during which interruptions from the garbage collector could be disruptive. For example, applications that need quick response times as market data changes during trading hours. This mode results in a larger managed heap size than other modes. Because it does not compact the managed heap, higher fragmentation is possible. Ensure that sufficient memory is available.
All the data used in these tests can be found in the spreadsheet GC Pause Times - comparision


